



Launch Recite Me assistive technology
A person’s fingers touch a digital screen displaying a blue world map. White lines and dots radiate across the map, with the word “Asia” visible near a small circular highlight.

Graphic Design: David McCandless' infographic award winners announced

—
Date
22 November 2013

There was info graphic goodness aplenty as the winners of the second annual Kantar Information is Beautiful awards were announced this week. Whittling down the hundreds of entries was a thankless task according to David McCandless, one of the judges and a formidable info graphic practitioner in his own right.

He said: “It’s hell on earth to judge a competition like this, the quality and inventiveness of the work is so high. Data visualisation is really a new, emerging design form and a rising trend across many disciplines: news, web, science, marketing, even politics. The sheer range of approaches, content and style in this work has to be seen to be believed.”

Tim Leong, Bloomberg and Italian studio Accurat were among the winners while Jacob Hagen and Kim Albrecht scooped the two student awards. Check out this year’s winners below!
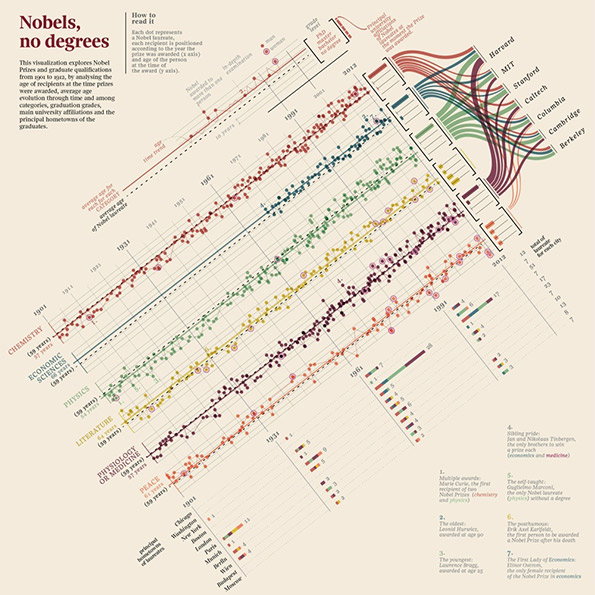
An information-dense data visualisation titled “Nobels, no degrees”. The chart uses coloured dots and lines to map Nobel Prize recipients by category, age, and university affiliation.
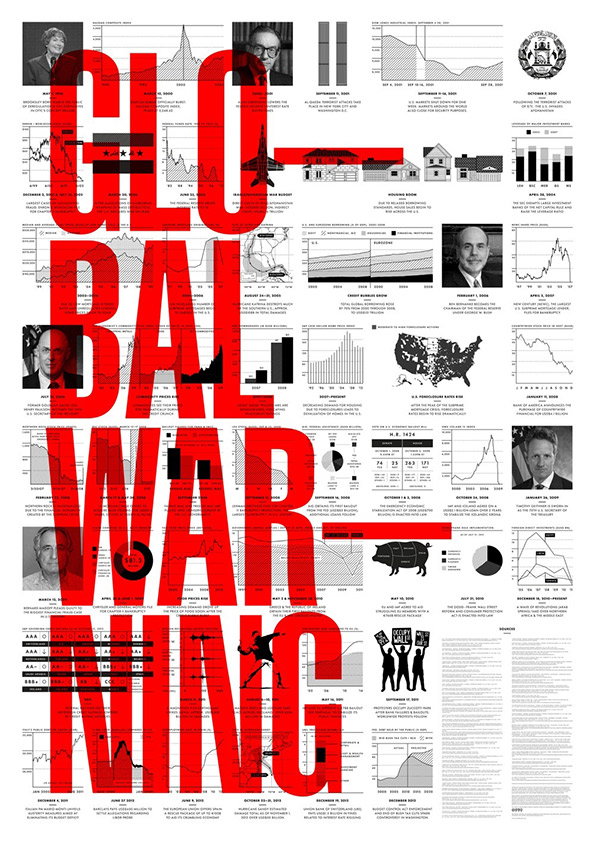
An information-dense poster featuring the words “GLOBAL WARNING” in large, bold red type. The text is layered over a complex grid of black and white data visualisations, including line graphs, bar charts, and portraits of political figures.
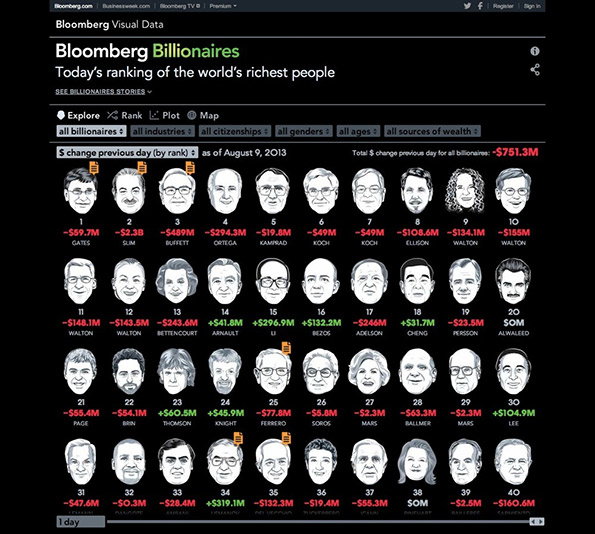
A data visualisation from Bloomberg titled “Bloomberg Billionaires” shows a grid of 40 portraits of the world’s richest people. Each person is paired with their rank, name, and the change in their wealth as of 9 August 2013.
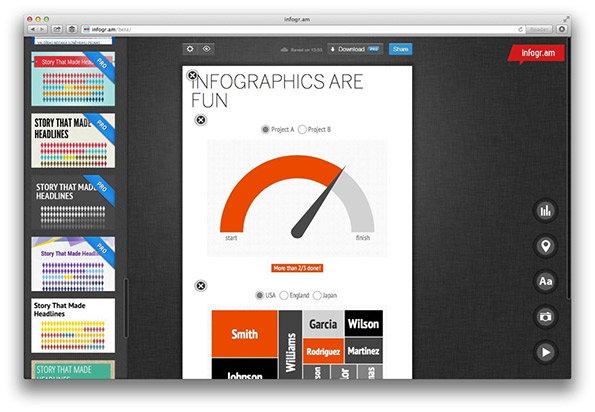
A screenshot of the Infogr.am website showing an infographic editor. The central canvas features a gauge chart and the headline “INFOGRAPHICS ARE FUN”.
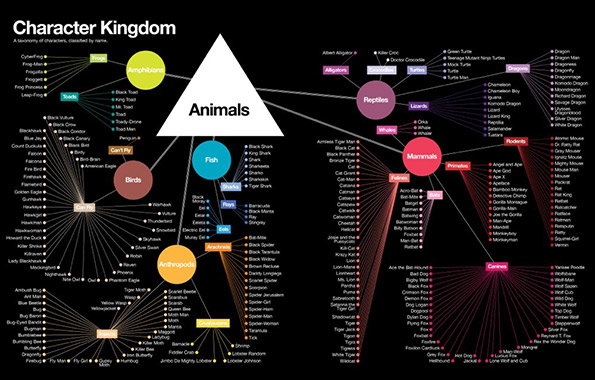
An infographic titled “Character Kingdom” maps out a taxonomy of fictional characters. A central white triangle labelled “Animals” branches out into colourful categories including “Mammals”, “Reptiles”, “Birds” and “Amphibians”.
Above

Tim Leong: Character Kingdom

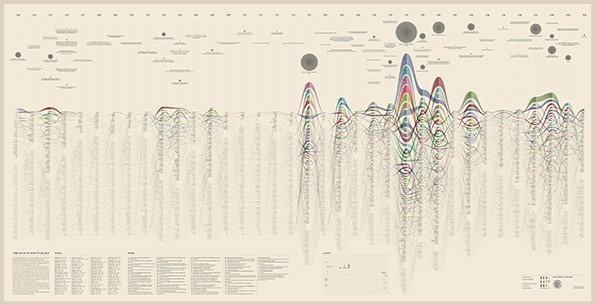
An intricate infographic on a cream background featuring a complex network of colourful, overlapping lines. The lines form several peaked, mountain-like shapes across the centre, accompanied by small circles and dense columns of text.
Above

Valerio Pellegrini: Atlas of Kant’s Legacy
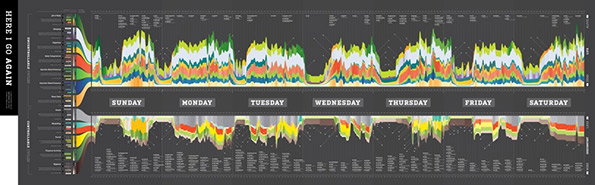
An information-dense infographic on a dark grey background titled “HERE I GO AGAIN”. A central timeline lists the days of the week, with colourful, jagged data peaks flowing above and below.
Above

Jacob Hagen: Here I Go Again

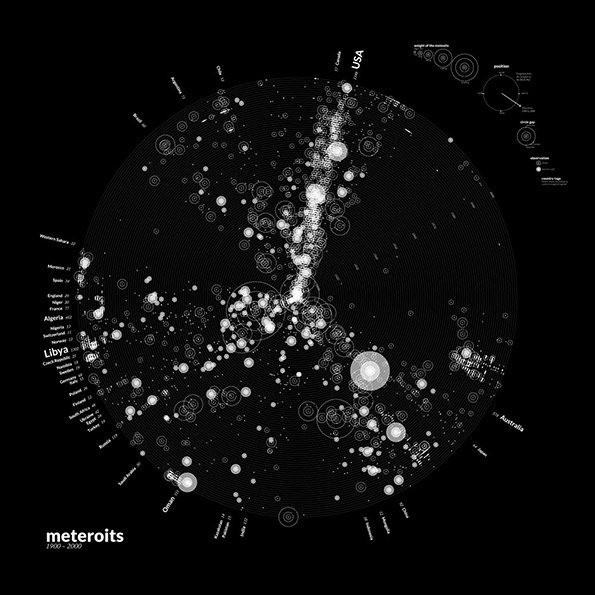
An infographic on a black background shows a circular data visualisation of meteorite falls. White dots and circles of varying sizes are scattered across the globe, with a dense cluster running through North America. The bottom left corner features the word “meteroits” and the dates “1900–2000”.
Above

Kim Albrecht: Meteorites 1900 – 2000

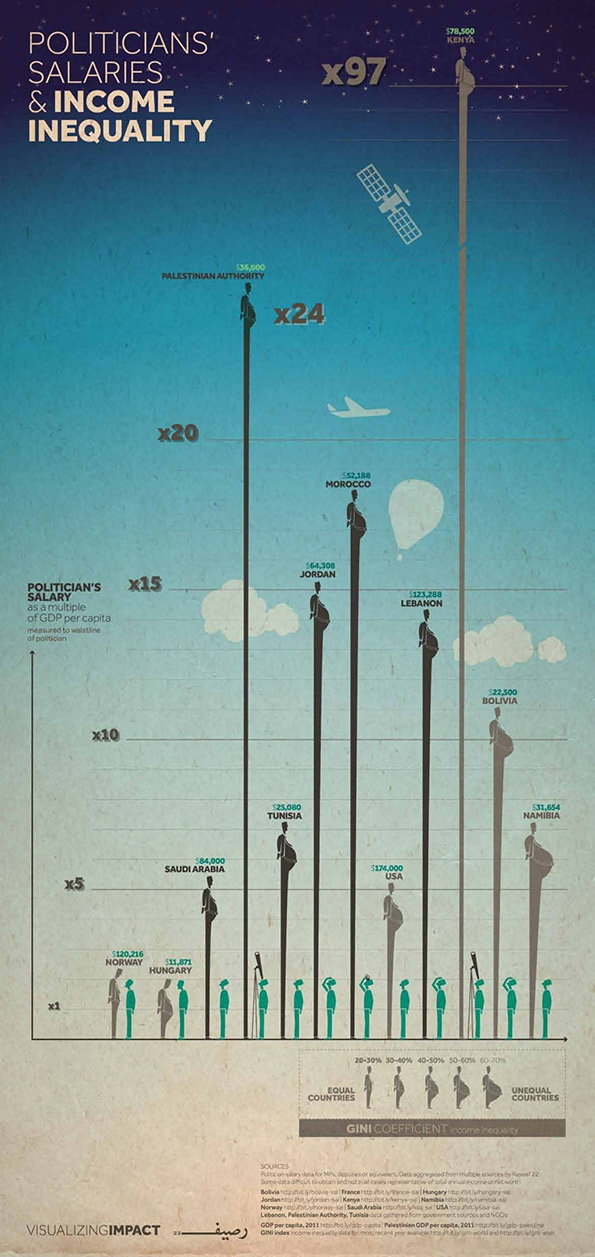
An infographic titled “Politicians’ Salaries & Income Inequality” uses vertical bars to compare politician salaries as a multiple of GDP per capita. The tallest bar represents Kenya at “x97”, while the shortest bars include Norway and Hungary. At the bottom, a scale of Gini coefficients illustrates the link between these salaries and income inequality.

Share Article

About the Author

Rob Alderson

—

Rob Alderson is a freelance writer, editor and strategist. He was previously editor-in-chief of It’s Nice That and WePresent, and editor of Design Week. He publishes the newsletter Undo, which tries to make sense of how AI is changing design work, the design process and the design industry.
It's Nice That Newsletters

Fancy a bit of It's Nice That in your inbox? Sign up to our newsletters and we'll keep you in the loop with everything good going on in the creative world.