


Launch Recite Me assistive technology
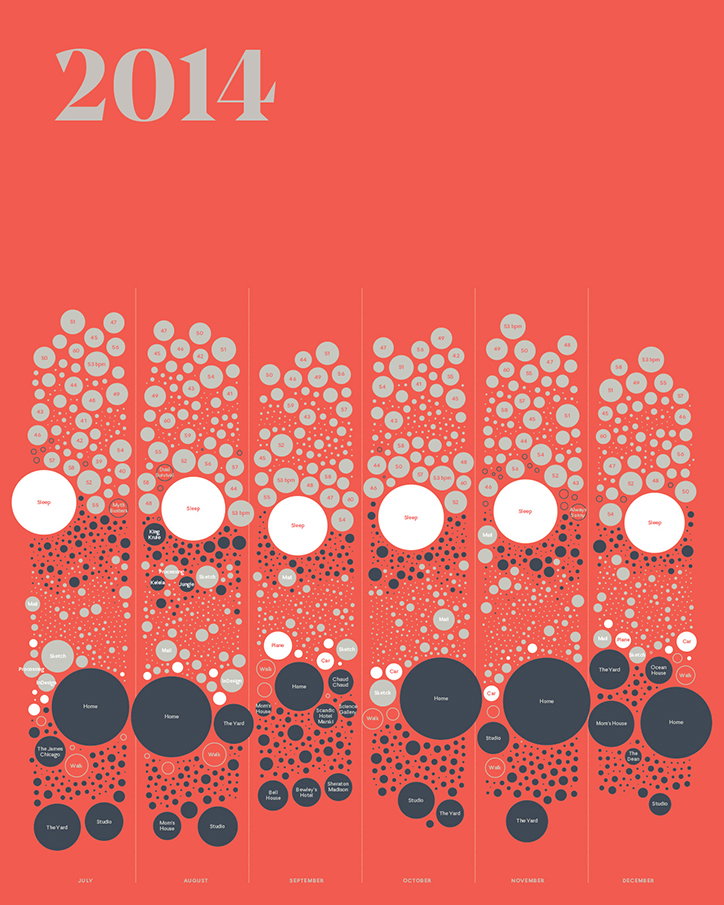
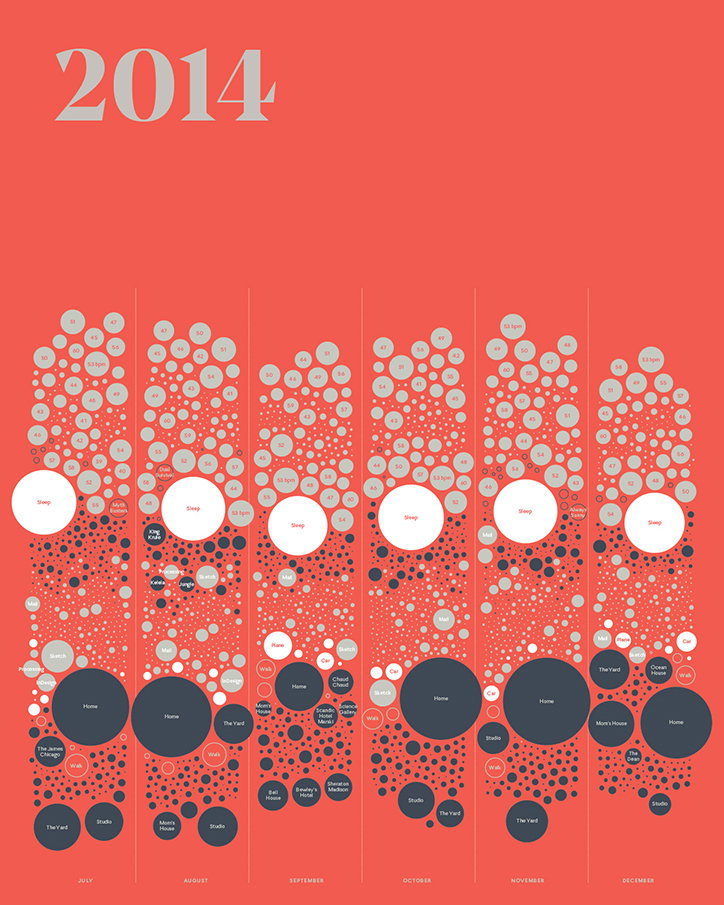
An infographic on a red background titled “2014”. A series of vertical columns for July to December are filled with grey and dark blue circles of varying sizes, representing data points.

Nicholas Felton releases final ever personal Annual Report

—
Date
16 October 2015

Back in 2005, when people still talked about Pete Doherty on Libertines forums and Tony Blair was still Prime Minister and this writer was still in short trousers, a man named Nicholas Felton somehow managed to set the bar for the “quantified self” movement that’s exploded over the last few years. And boy, did he set that bar high, creating an Annual Report each year that laid out his personal data, from weight to how many miles he’d flown to the books he’d read and the photographs he’d taken.

Painstakingly laid out in infographics and charts, these became the Feltron Annual Reports (the additional “r” in his name as a sort of design pen name, almost separating the reports from life). Now, ten years on, he’s helped shape the Facebook timeline design, seen his work placed in MoMA’s permanent collection and launched iPhone app Reporter, which helps users record and visualise subtle aspects of their lives. His most recent Annual Report has just surfaced, and it’s the one that the designer says is his last.

“The world of personal data has changed considerably since the project began in 2005 and this edition attempts to capture its current state,” Nicholas says on his site. “While previous editions have relied on custom solutions to gather ethereal personal data, this edition is based entirely on commercially available applications and devices.”

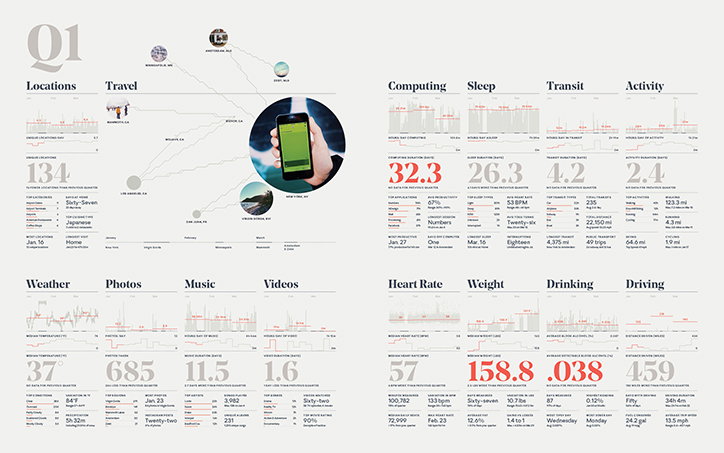
As with previous reports, we see Nicholas’ car, computer, location, environment, media consumption, sleep, activity and physiology instrumented and logged, but this time using just readily available products and software. What do we learn? That in Q1 he weighed an average of 158.8 lb, that he drove a total of 459 miles, and that he took a whopping 685 photographs. Why do we care? We’re not sure, but it’s utterly compelling, and this decade-long body of work is testament of the power of design to allow us to read and communicate our lives, and in Nicholas’ case, to predict a trend that today in the world of FitBits and phone pedometers seems almost commonplace.
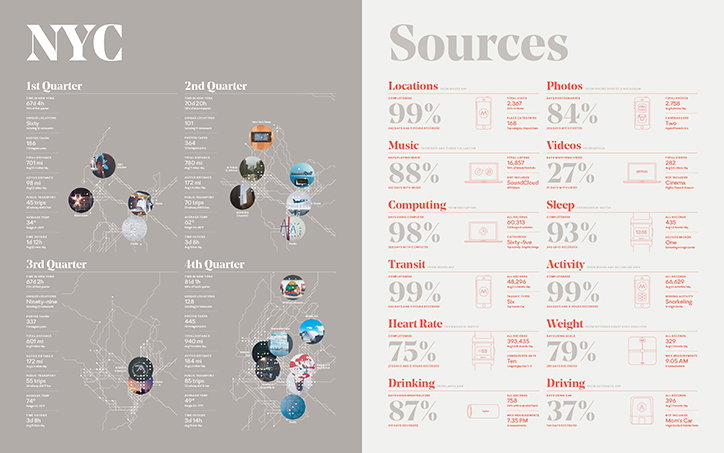
An infographic titled “NYC” displays data across four quarters of a year. Each section features a map of New York City with circular image markers and lists of statistics. The second page, titled “Sources”, breaks down data categories such as “Locations”, “Music” and “Sleep”. Each category includes a percentage, a small icon and a summary of total records.
Above

The Feltron Annual Report 2014

An infographic titled “Q1” displays a person's quantified self data across various categories. The layout features a map of travel locations alongside data grids for computing, sleep, transit, activity, weather, photos, music, videos, heart rate, weight, drinking and driving.
Above

The Feltron Annual Report 2014

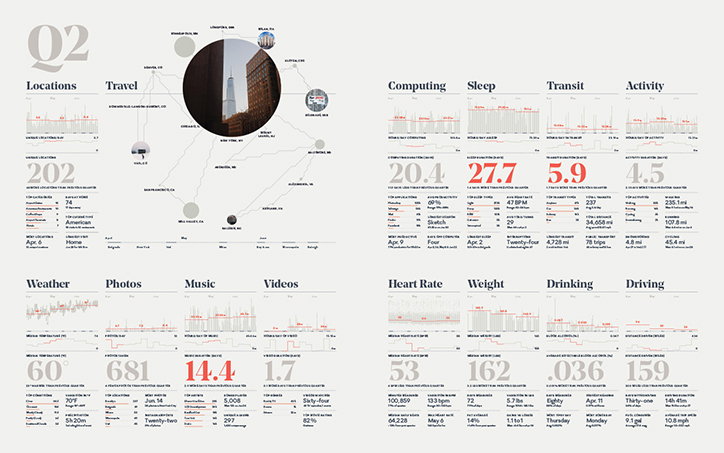
An infographic titled “Q2” displays a collection of personal data visualisations across two pages. The layout includes a map of travel locations and various charts tracking metrics such as “Computing”, “Sleep”, “Heart Rate” and “Weight”.
Above

The Feltron Annual Report 2014

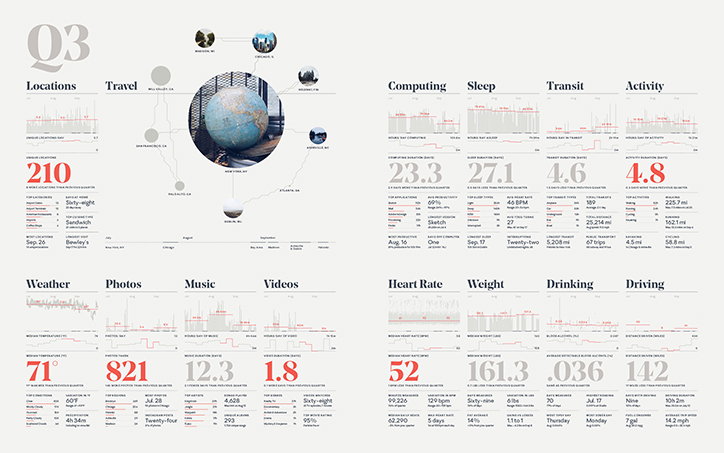
An infographic titled “Q3” displays a collection of personal data across various categories. A central globe is surrounded by a map of locations, while grids of charts and red numerals track metrics for sleep, heart rate and activity.
Above

The Feltron Annual Report 2014

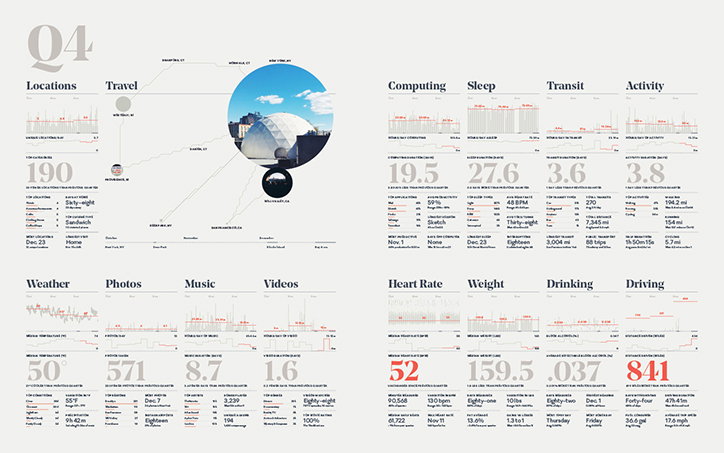
An infographic titled “Q4” displays a detailed data visualisation of a person’s life over a quarter. The layout features various categories including “Locations”, “Sleep”, “Weather” and “Heart Rate”, each with its own set of graphs and statistics.
Above

The Feltron Annual Report 2014

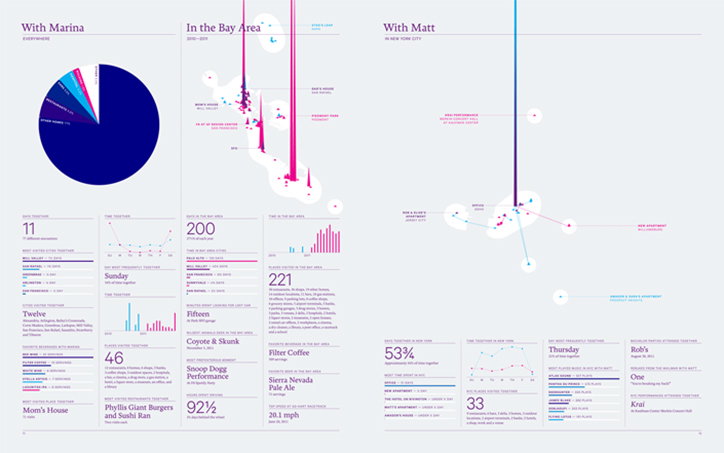
An infographic divided into three columns titled “With Marina”, “In the Bay Area” and “With Matt”. The layout uses a palette of blue, pink and white to display data through pie charts, line graphs and abstract 3D shapes.
Above

The Feltron Annual Report 2011

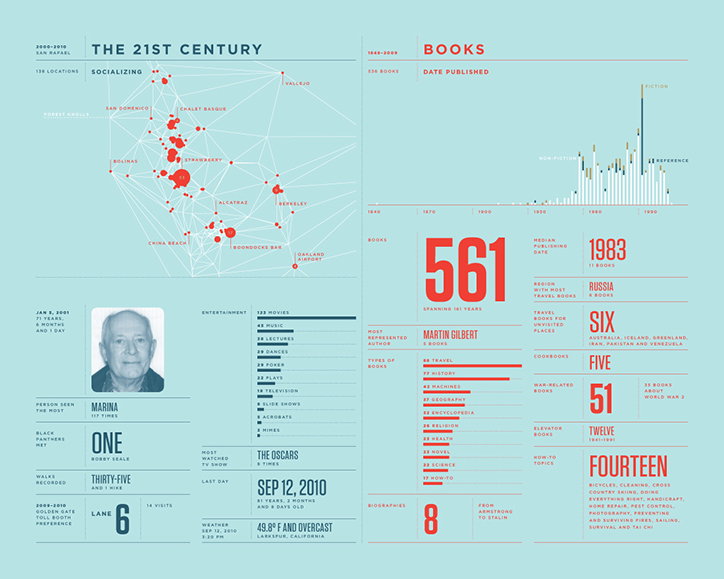
An infographic titled “The 21st Century” and “Books” presented on a light blue background. The left side features a map of the San Francisco Bay Area with red clusters marking social locations, alongside a portrait of a person and various personal statistics. The right side displays data on a collection of 561 books, including a publication timeline and a list of genres.
Above

The Feltron Annual Report 2010

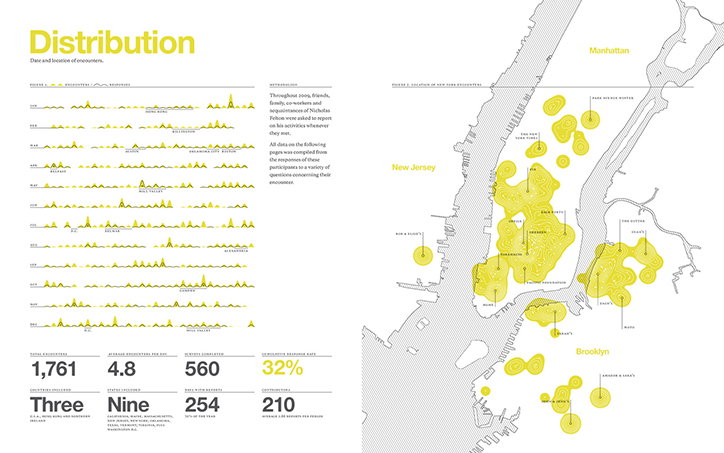
An infographic titled “Distribution” mapping the date and location of encounters. A map of New York and New Jersey shows clusters of yellow heat-map circles across Manhattan and Brooklyn.
Above

The Feltron Annual Report 2009

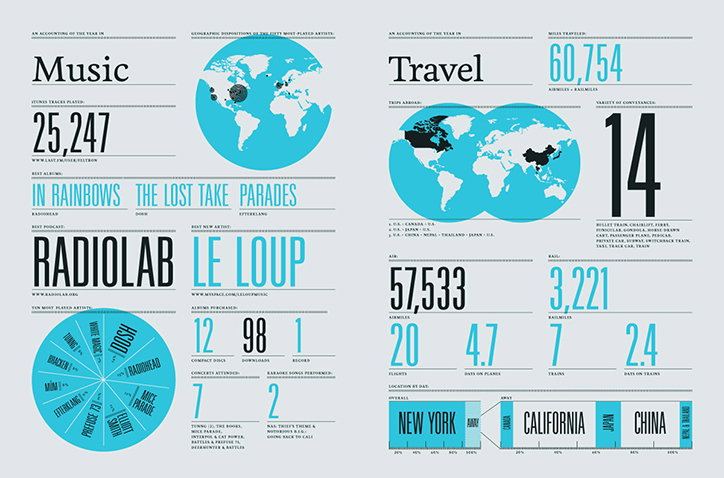
An infographic titled “Music” and “Travel” that tracks a person’s yearly activity. The music section features a world map, a pie chart of artists, and statistics including “25,247” tracks played. The travel section shows a map of trips abroad, “60,754” miles travelled, and a list of destinations including “New York”, “California” and “China”.
Above

The Feltron Annual Report 2007

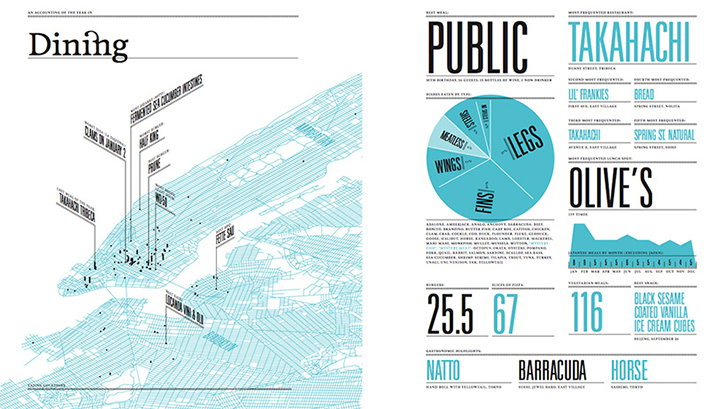
An infographic titled “Dining” featuring a light blue map of New York City. The right side displays data on eating habits, including a pie chart and the names “Public”, “Takahachi” and “Olive’s”.
Above

The Feltron Annual Report 2007

Share Article

Further Info

About the Author

Emily Gosling

—

Emily joined It’s Nice That as Online Editor in the summer of 2014 after four years at Design Week. She is particularly interested in graphic design, branding and music. After working It's Nice That as both Online Editor and Deputy Editor, Emily left the company in 2016.

It's Nice That Newsletters

Fancy a bit of It's Nice That in your inbox? Sign up to our newsletters and we'll keep you in the loop with everything good going on in the creative world.