

- Words
- Olivia Hingley
- —
- Date
- 9 November 2026
- Tags
Mona Chalabi’s illustrated book about wealth inequality will make you talk to your friends about money
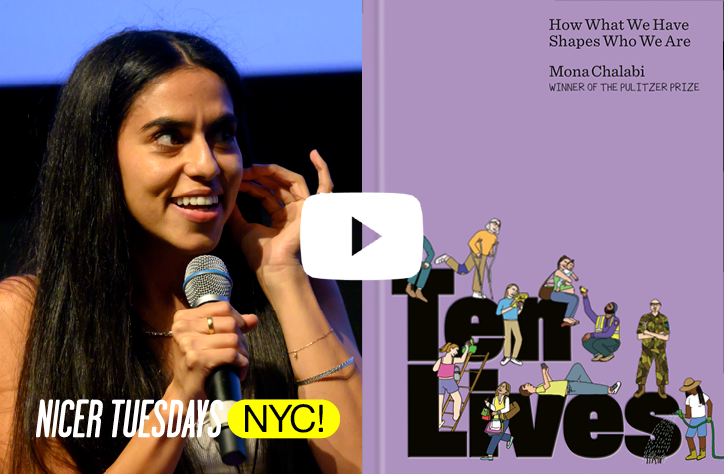
Think you’re not a ‘numbers person’? The Pulitzer Prize-winning illustrator and journalist Mona Chalabi wants you to think again. On the release of her new book, Ten Lives, she chats about how pictures have the power to make economics accessible.
Share
Share
I’ve never been good with numbers. I’m what you might call a ‘words person’. In fact, the mere sight of a mathematical equation is enough to send me into a cold sweat; those blackboard scenes in A Beautiful Mind and Good Will Hunting fill me with unshakeable dread. I’m fairly certain that there’s many reading this (artists, designers, illustrators) who will feel the same way – siphoned off at school into paths that suited your more ‘creative’, less ‘academic’ leanings. But there’s one person who’s very keen to challenge the tendency society has to put our brains in boxes: journalist and illustrator Mona Chalabi.
“Ten Lives proves that it’s not the numbers causing problems, but the way they’re habitually presented to us.”
Olivia Hingley
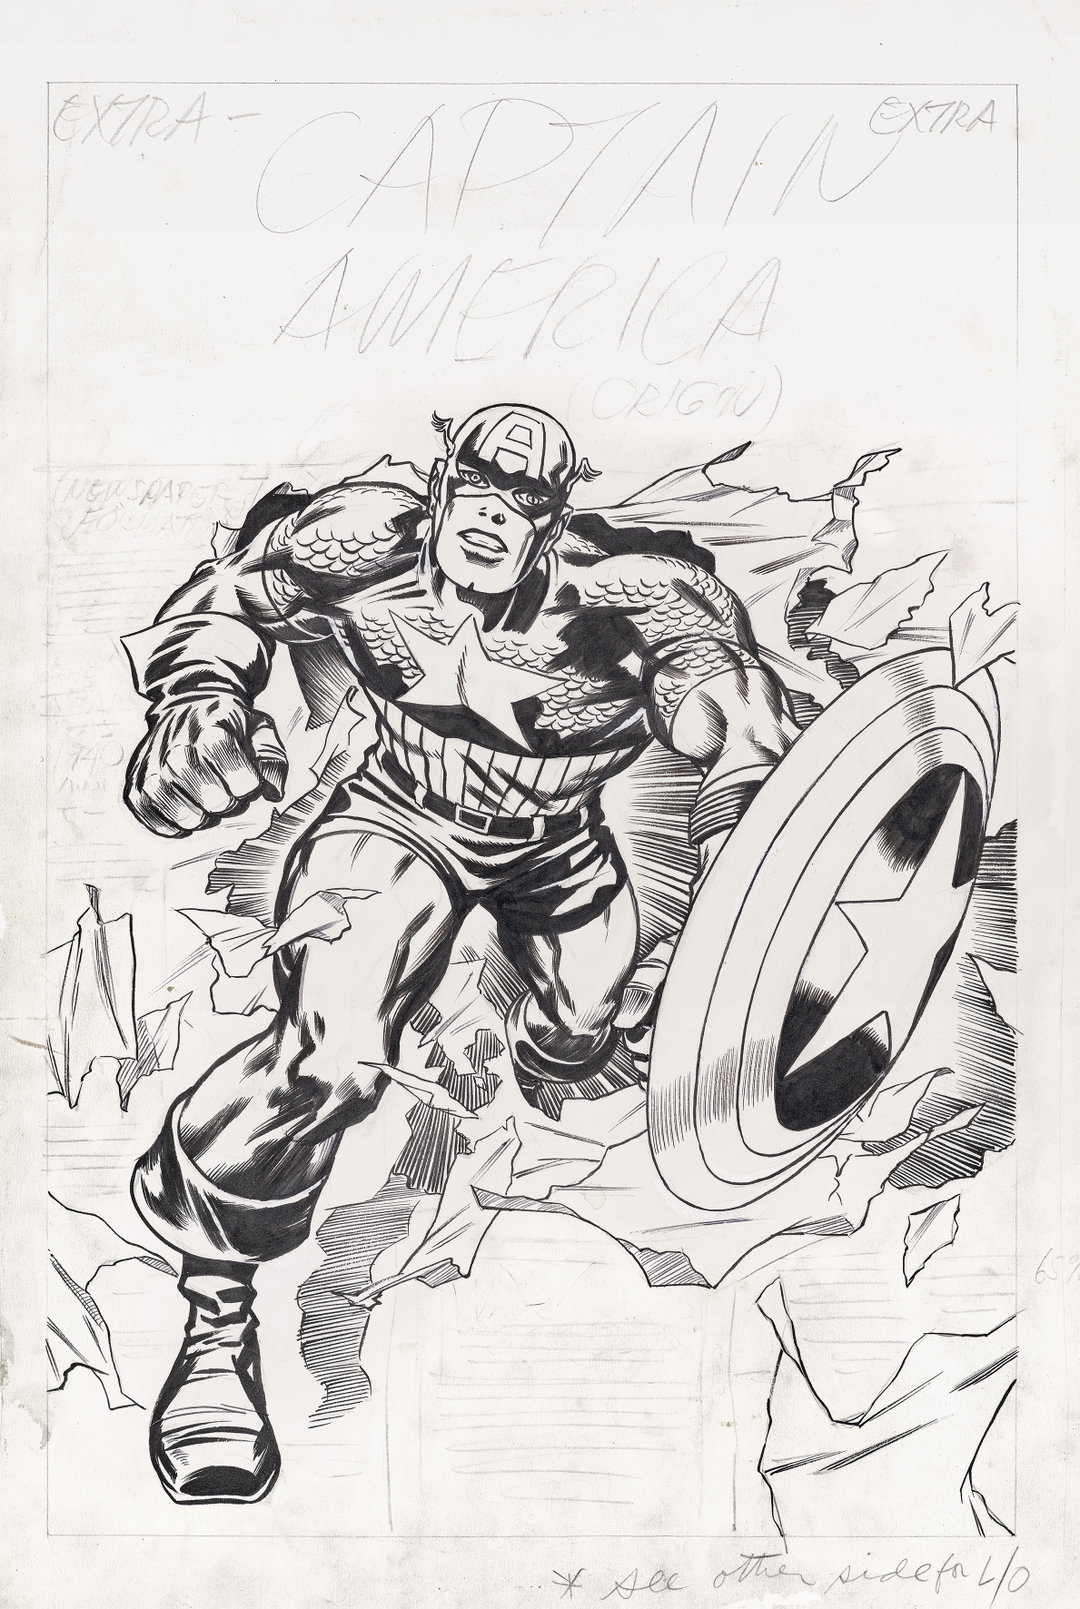
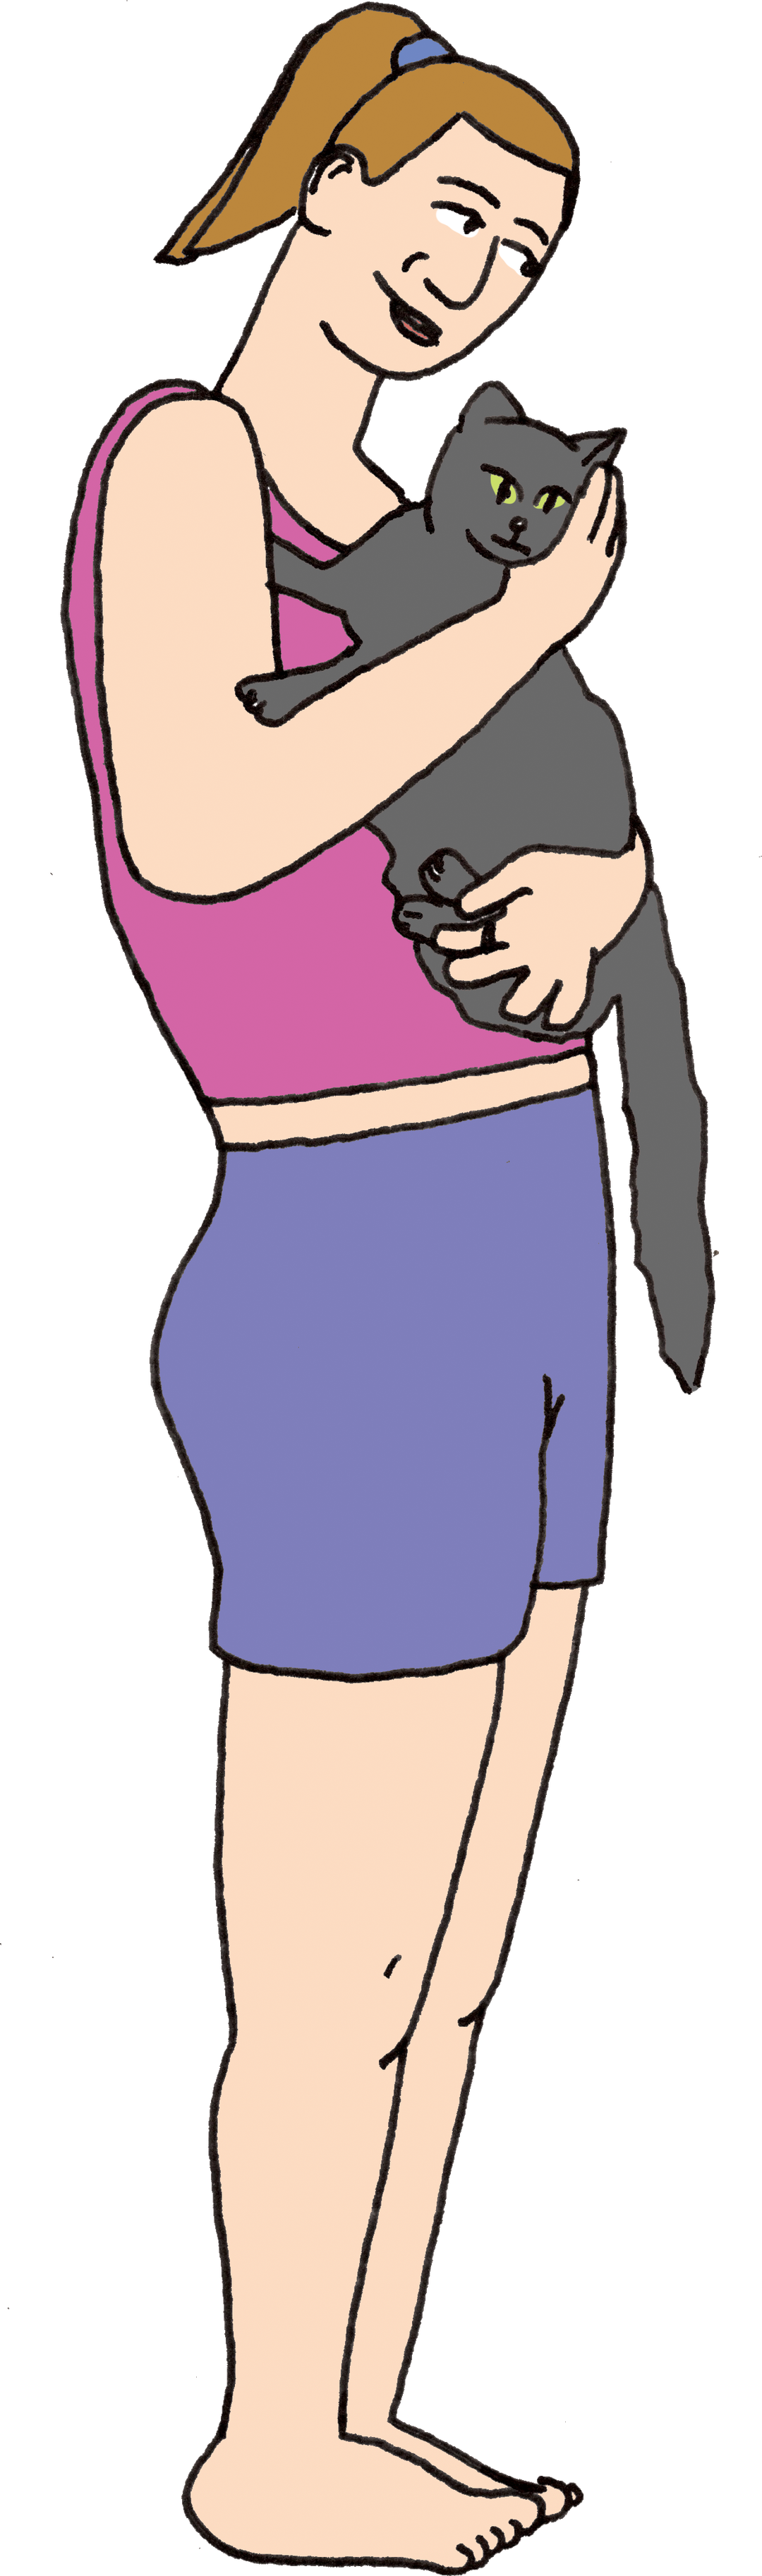
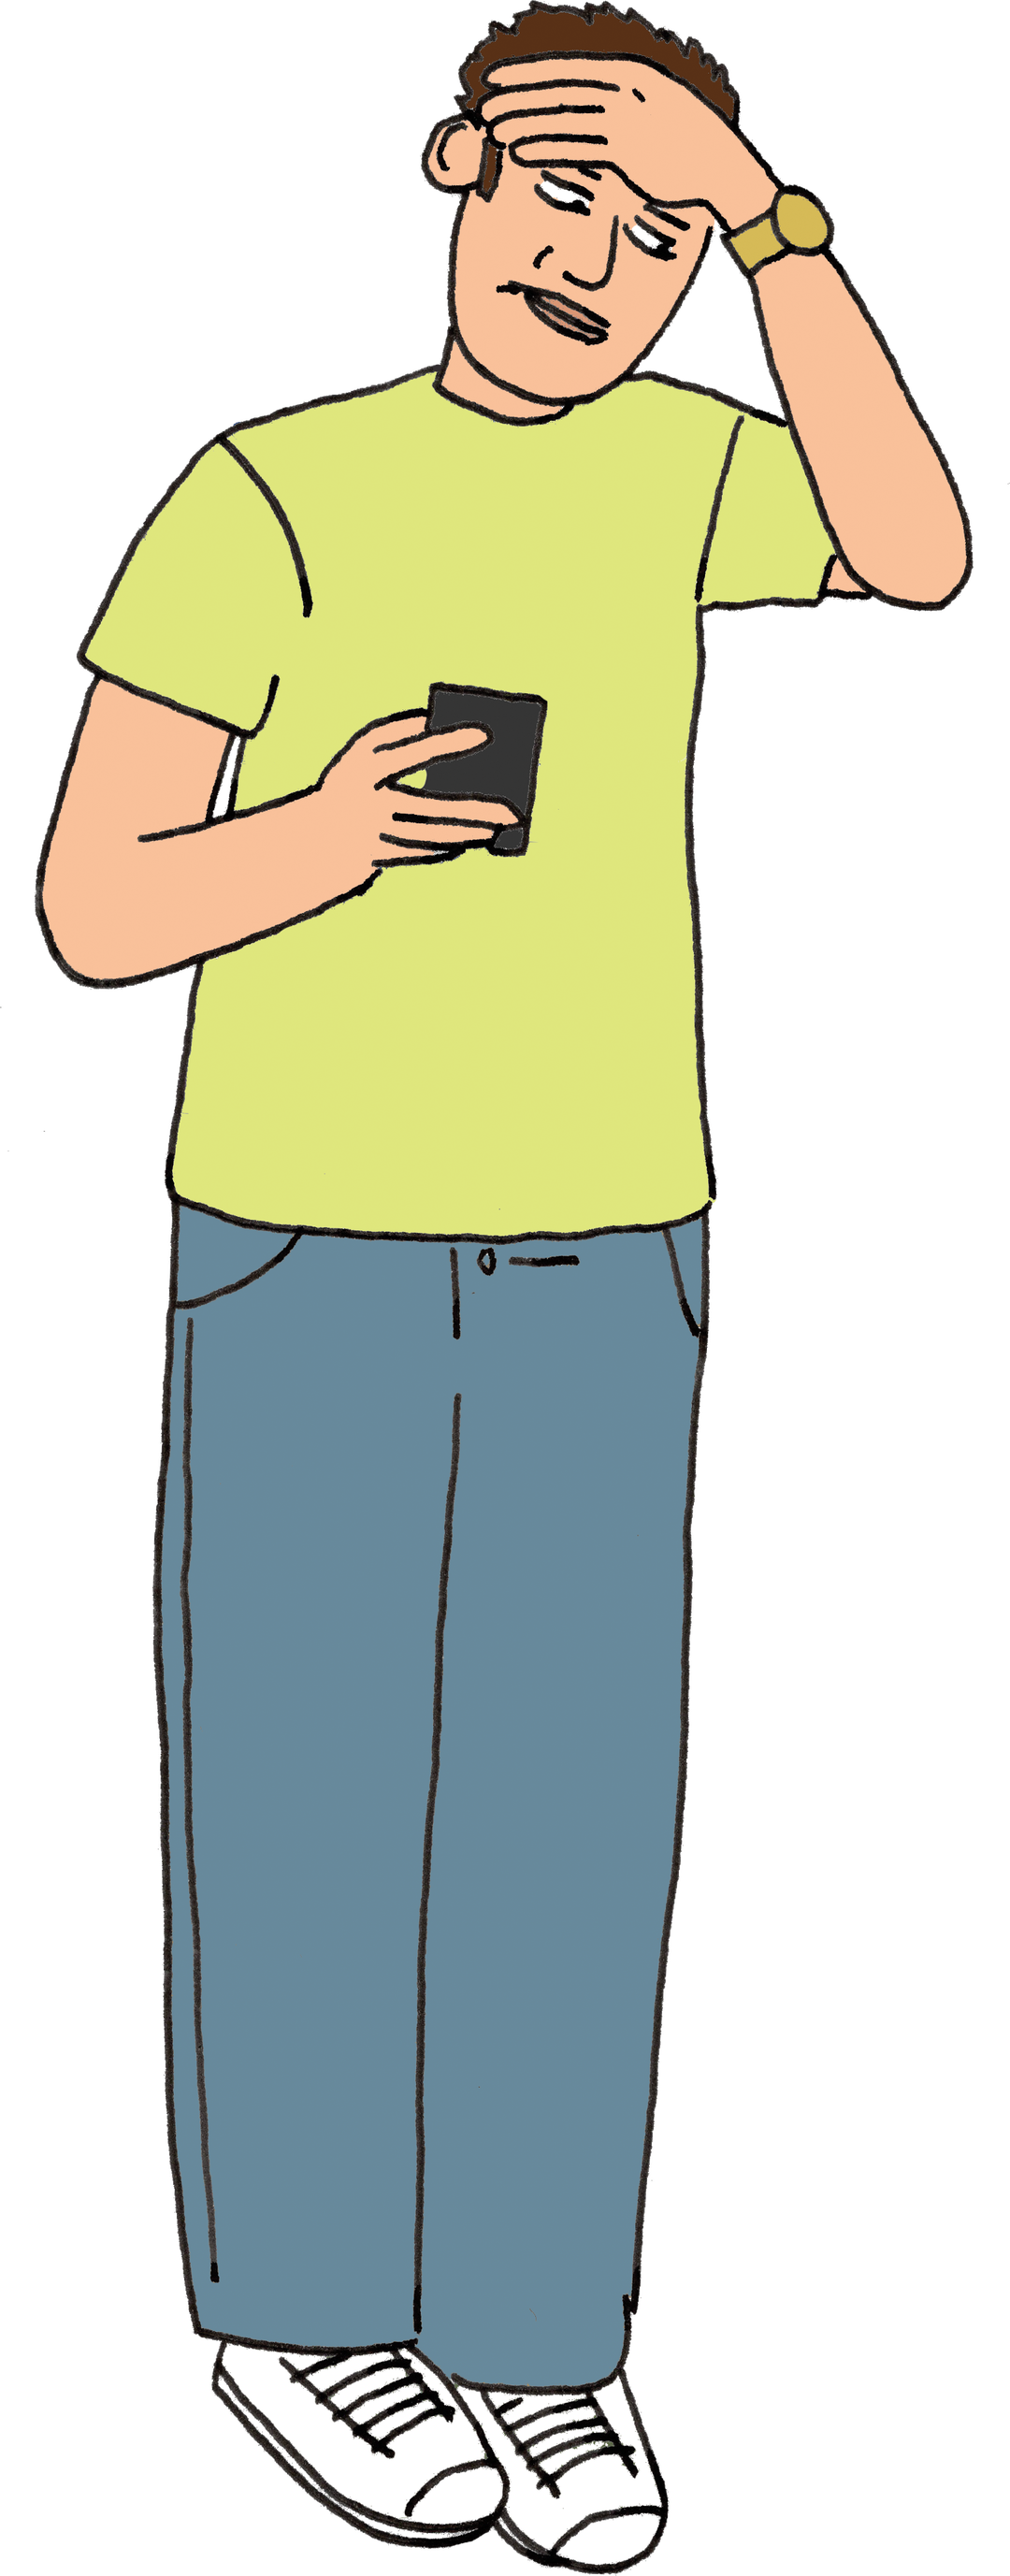
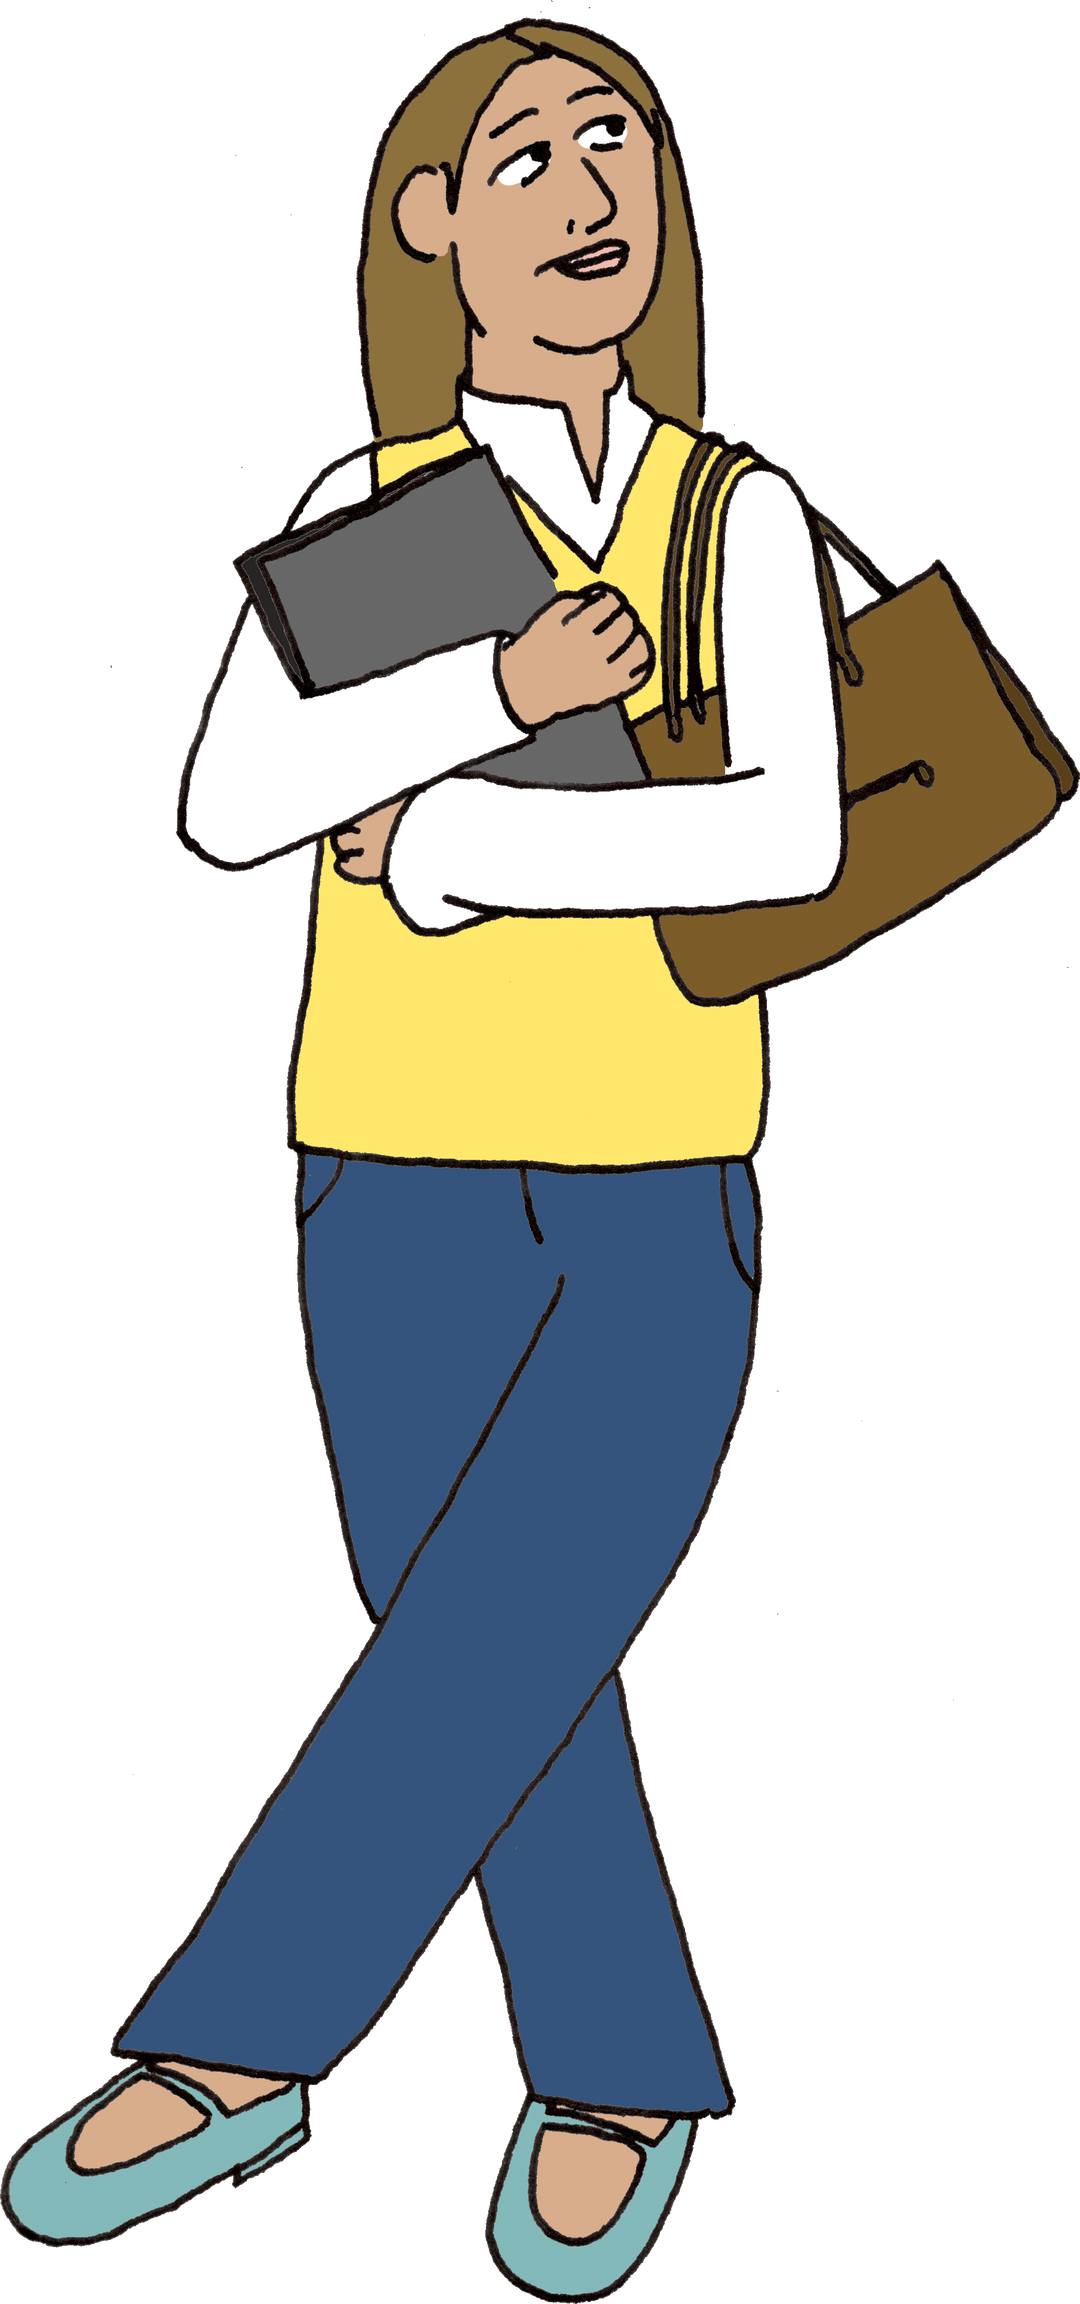
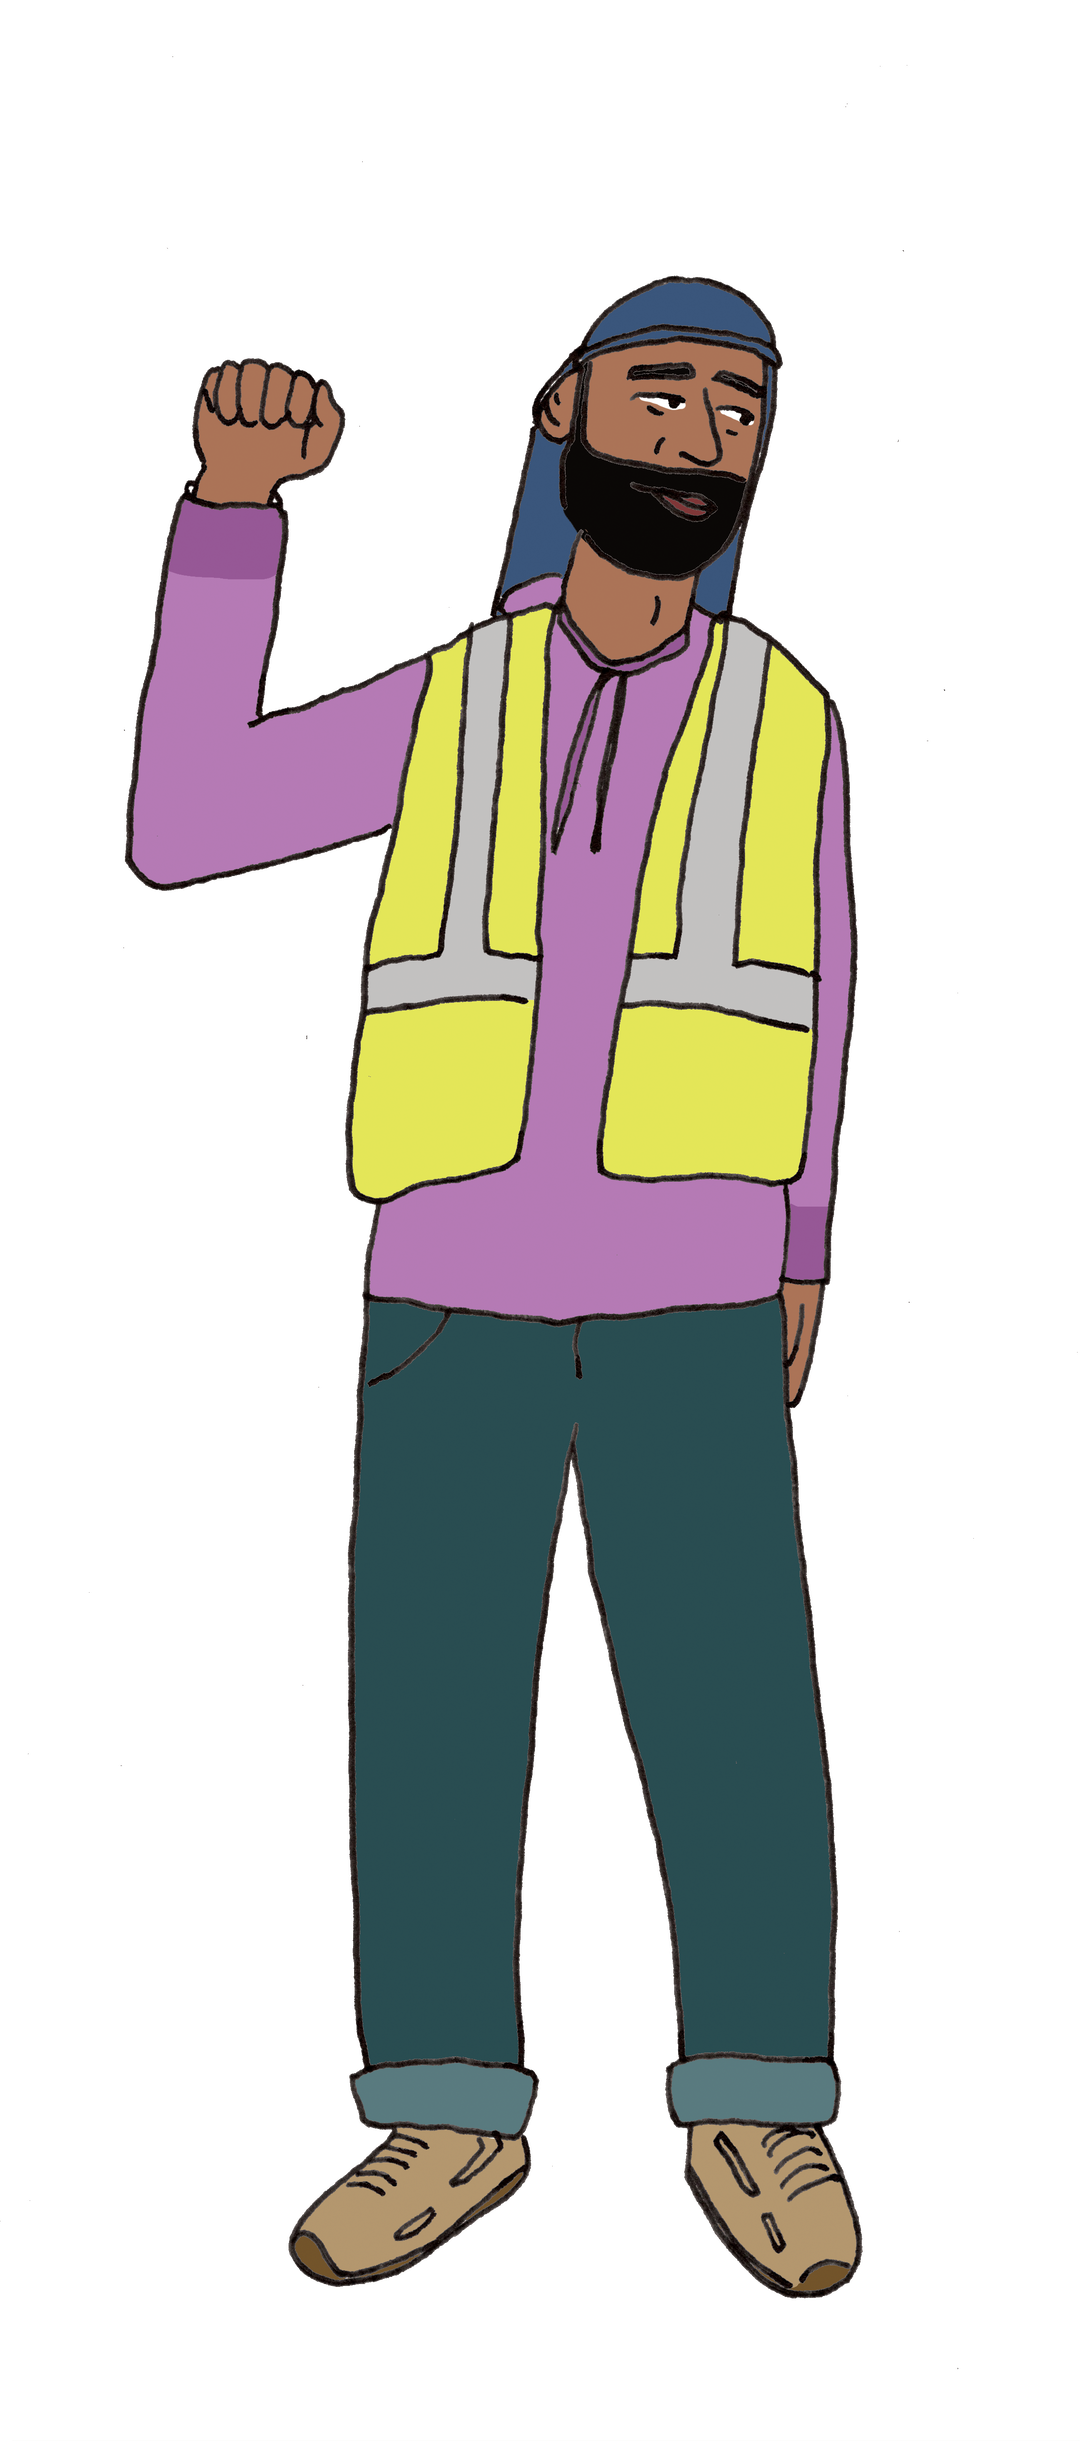
Her groundbreaking book, Ten Lives: How What We Have Shapes Who We Are, follows ten people across the US who exist in different income deciles. For five years Mona interviewed each person, gathering the lived experience of how their wealth (or lack thereof) impacts every corner of their lives: relationships, education, self-worth, health – physical and mental. Corroborated with in-depth research into official datasets, visualised with illustrations that undo the traditional function and form of graphs, and tied together with a narrative that weaves between non-fiction, storytelling and Mona’s own memoir, Ten Lives isn’t just informative on how ruinous the wealth gap is and how flimsy financial security is, but a deeply enjoyable read too.
The book is essentially a 300-odd-page manifesto for one of the driving forces behind Mona’s whole career: that data and numbers should be more broadly accessible, and creativity is a key tool to facilitate this. Ten Lives proves that it’s not the numbers causing problems, but the way they’re habitually presented to us. So, who knows, maybe I’m not bad at numbers? And maybe, this deeply instilled idea that I am is, in fact, as Mona says, “by design”.
1 of 5
1 of 5
It’s Nice That (INT):
This is the first time I’ve ever read a whole book about economics, something I feel like I’ve never properly grasped before – which feels pretty major for me! Why do you think it’s so important to find creative ways to make topics like economics, money and wealth inequality, a bit more accessible?
Mona Chalabi (MC):
I think you’re a smart person, right?
INT:
I hope so!
MC:
You’re a smart person! I think a lot of people feel that these subjects are dense, incomprehensible, and that’s partly by design, right? I actually think there isn’t that much effort involved to make this information more accessible, and I think sometimes what happens is people have an almost emotional reaction to numbers. At some point in your life, you decided you’re not a numbers person, and now each time you see a chart, some part of your brain just says ‘that’s not for me, I’m not going to get it.’ I really hope that my work challenges that by giving people an ‘in’ and letting them know that, look, if I understand this stuff, I truly believe that you can too.
Unless we feel empowered to understand the way that things are, how can we even possibly begin to change them? People have a widespread understanding of income inequality being ‘fucked up’, but I don’t think people feel empowered to even understand what to do about that, other than shaking their fist at the 1-per-cent.
INT:
On this emotional reaction, one of the things I found interesting about the way you talk about money in the book is your very multi-sensory reaction to it: ‘This book isn’t about quantities, it’s about the way numbers make us feel,’ you write. How can listening to this emotional response lead to tangible change?
MC:
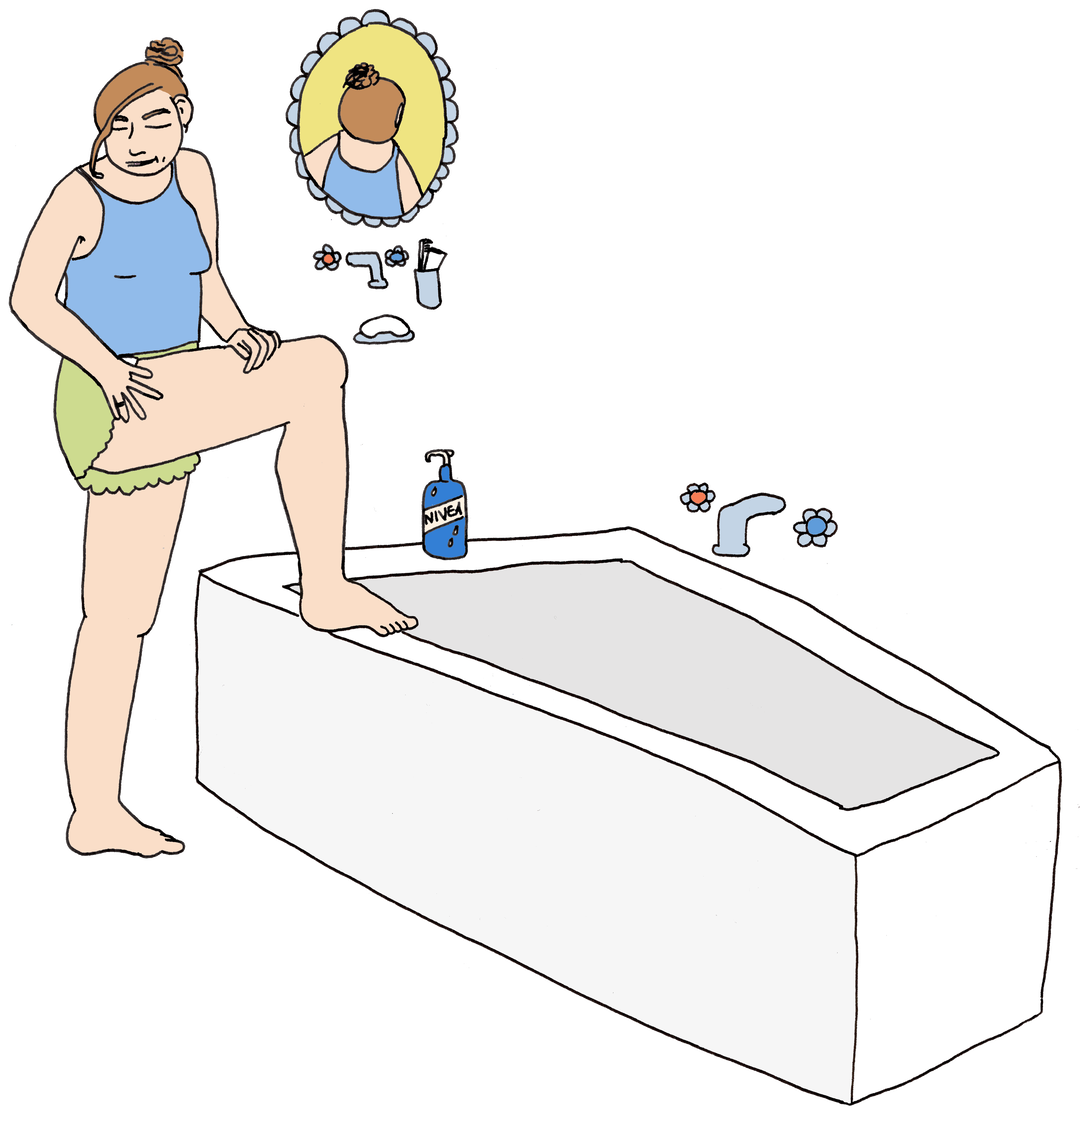
Very often we do have a visceral reaction to money; you have a visceral reaction when your friend tells you about the new place that they’ve bought or the new place that they’re renting, but we really try to suppress it. If we could just be more honest about the reactions that we’re having, there’s much more chance to mobilise and turn it into something collective, rather than something that is so individualised.
Caption
Caption
Caption
INT:
It’s true! This is a book I want to give to my friends. I’d love to zoom in on your process. What does it look like?
MC:
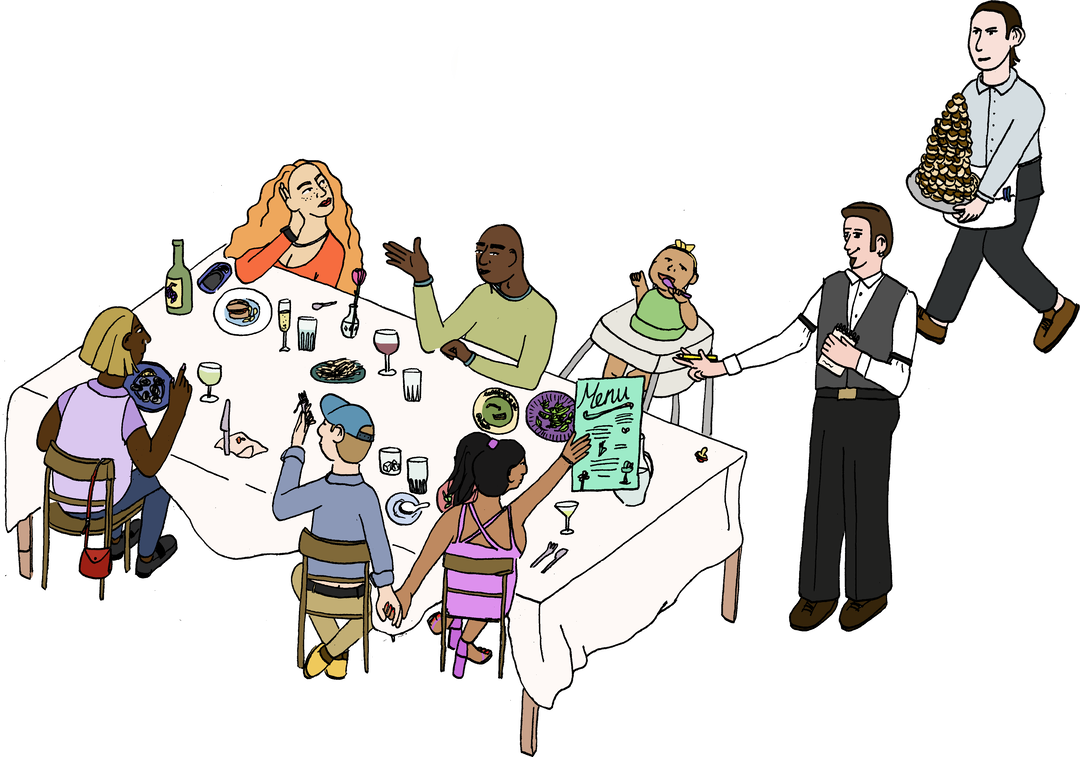
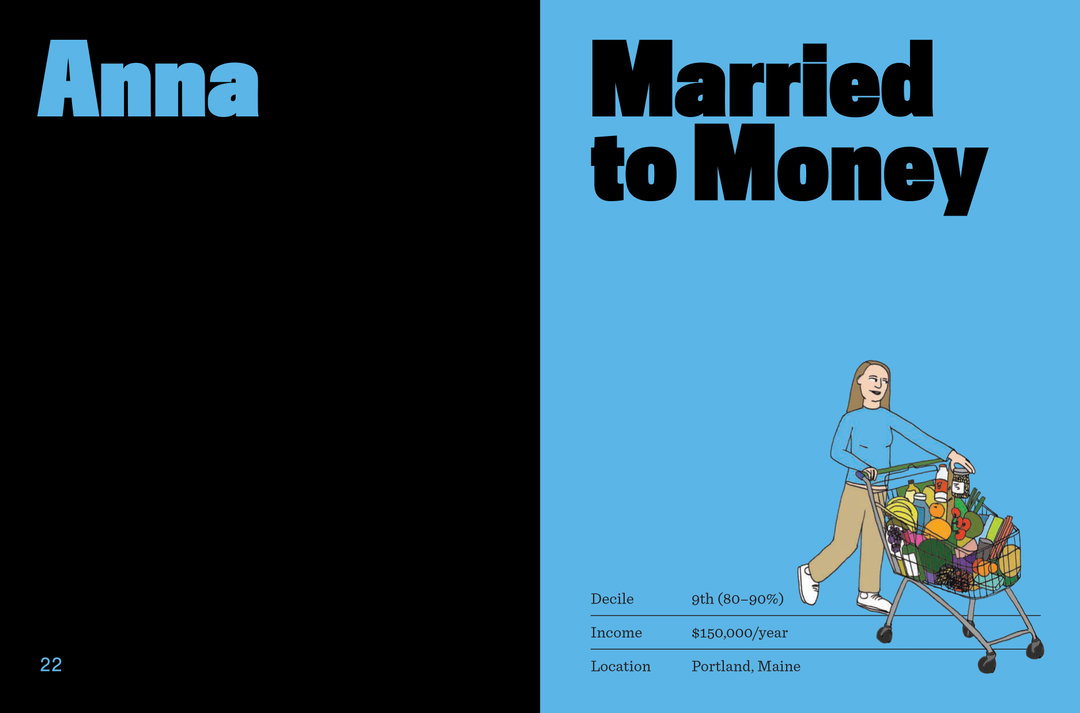
It’s really all over the place. For example, I knew before I started writing the book that I wanted to speak to somebody as one of these ten lives who was doing surrogacy. I thought surrogacy was a really interesting subject – it’s somebody who’s risking their body to earn money, which happens all the time, whether it’s builders, care workers, people working in warehouse facilities, but there’s something about that confluence of maternal health and physical risk that felt particularly interesting to me.
From there, I spent time meeting this person, listening to what they have to say, and they challenge your assumptions. I went into those conversations thinking that some of it was going to be about how challenging it is to hand a baby that you’ve carried for nine months over to someone else, and that’s just not the case at all for a lot of people who do surrogacy. So it’s listening, and then trying to find research that’s interesting to understand the subject.
It’s honestly such a mix. Someone would be talking to me about the age that they moved out of home, and all of a sudden I’m like, ‘Wait, what is the average age that people move out of home? Let me see if I can find data on this, and then let me think about a visualisation for it.’ Sometimes the data is informing the questions that I’m asking people, and sometimes the answers that I’m hearing from people are informing the research.
“When you just rely on the average, you’re missing so much about the way that the world is.”
Mona Chalabi
INT:
It sort of relies on ideas sparking ideas, between one process to the other?
MC:
Completely. It’s very symbiotic – a bit of everything. And I think that’s important, because otherwise, if you’re only starting with the data, it’s quite tempting to seek out voices who are confirming what you’re already seeing.
INT:
Interesting.
MC:
And similarly, if you’re only going by these anecdotal stories, I think you could end up with quite a skewed understanding of stuff. It felt really important to me to weave together the interviews and the data, because one of my critiques of data is that it flattens out these outliers. When you just rely on the average, you’re missing so much about the way that the world is.
INT:
Not every single data set or concept has a visualisation. How do you decide which ones would benefit from a visualisation?
MC:
That’s such a good question. I was approached for a number of years before I wrote this book, like, ‘We want to do a book of your illustrations’. That did not interest me whatsoever! There’s no intellectual challenge in that – it’s just like gathering and curating the stuff that I’ve already done!
I was really clear that I didn’t want this to be a coffee table book. I want this to be a book that you can carry around, and I want it to be a book you’re supposed to read from start to finish. That really informs the number of illustfpauserations, because I wanted this specific ratio of words to images. I wanted it to be that these illustrations are in service of the text, it’s not that the text is just there to explain around the images. I wanted to choose illustrations for subjects where there would be something that’s quite counterintuitive or surprising that you’re going to discover, even if the data isn’t necessarily ‘surprising’.
Caption
INT:
On Megan’s story, in the middle of the book, why did you think that would make sense as a graphic novel, breaking away from the form that bookends it either side?
MC:
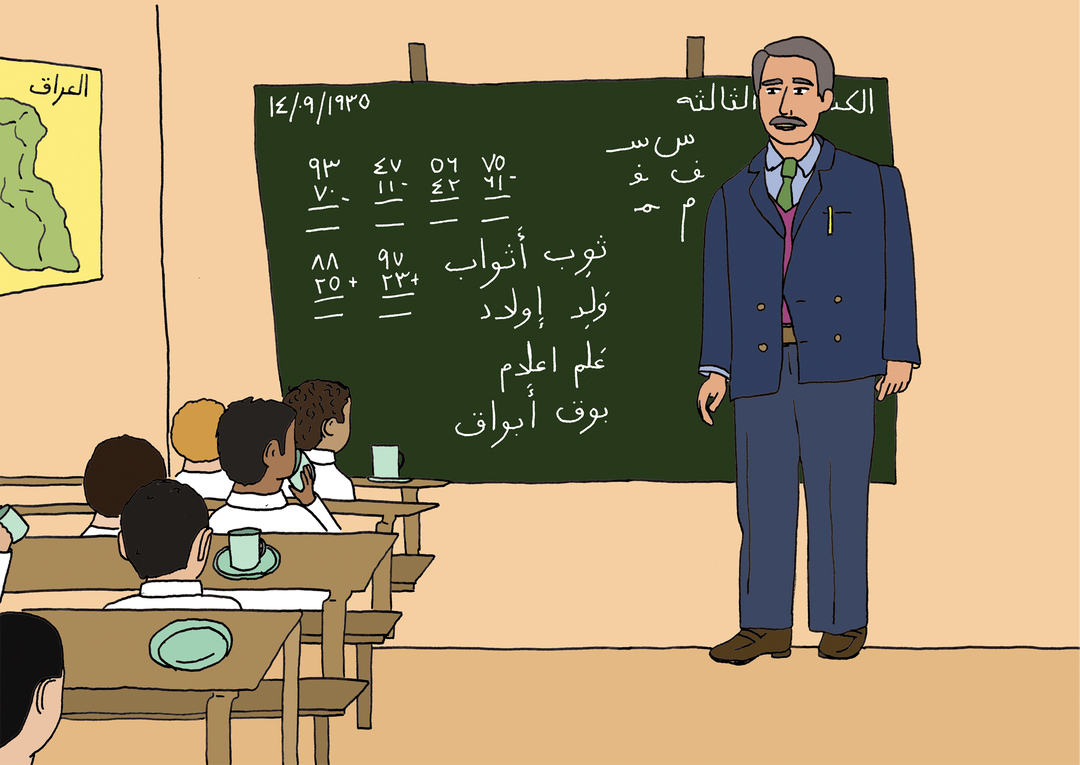
So there’s two reasons. One, I love graphic novels. It amazes me that they’re not more read than they are! I just think they’re just incredible as a form of storytelling. It was so moving to me that Alison Bechdel gave me a blurb, she’s such an icon. The second reason is less sexy to talk about – it was just pure pragmatism. Megan kind of vanished on me, which happens, right? She just got exhausted by the interviews. You’re paying people, but for her it’s not a vast amount of money, and I’m asking her for a lot of her time. We were getting really close to when I needed to submit the manuscript, I couldn’t find somebody again who fits within this exact decile. So, basically, I was like, if I make it a graphic novel, I can stretch it out.
INT:
Wow, I wasn’t expecting that! I just think it was quite nice how the story wove into something else. I’d love to know, how much do you concern yourself with ‘style’? Or things in the book feeling ‘right’, or ‘perfect’? In journalism, you have to be going pretty quickly!
MC:
Oh, god. Well, I would have rather not gone quickly! I didn’t do the design by myself, I worked with three other people, Jenny Davies at Penguin Random House, and then we worked with designers Elana Shlenker and Jordi NG. They’re incredible!
I wanted to keep on revising the book. Like, this is not my final version of the book as far as I’m concerned. For me, the design isn’t done, and I don’t think design is ever done. I personally think design should also be a living thing. This is my first book, I’ve learned so much about how all of it works. But, like, right now, the book is open to page 59, and I’m not happy with how the skin tones look – I actually think they look a little greenish and grayish. And they looked absolutely fine on the PDF!
INT:
File to print is a whole different beast, isn’t it? Every single person in the book, bar one, has been anonymised. So the people you’ve drawn to represent them, is it them or is it a reimagining of them?
MC:
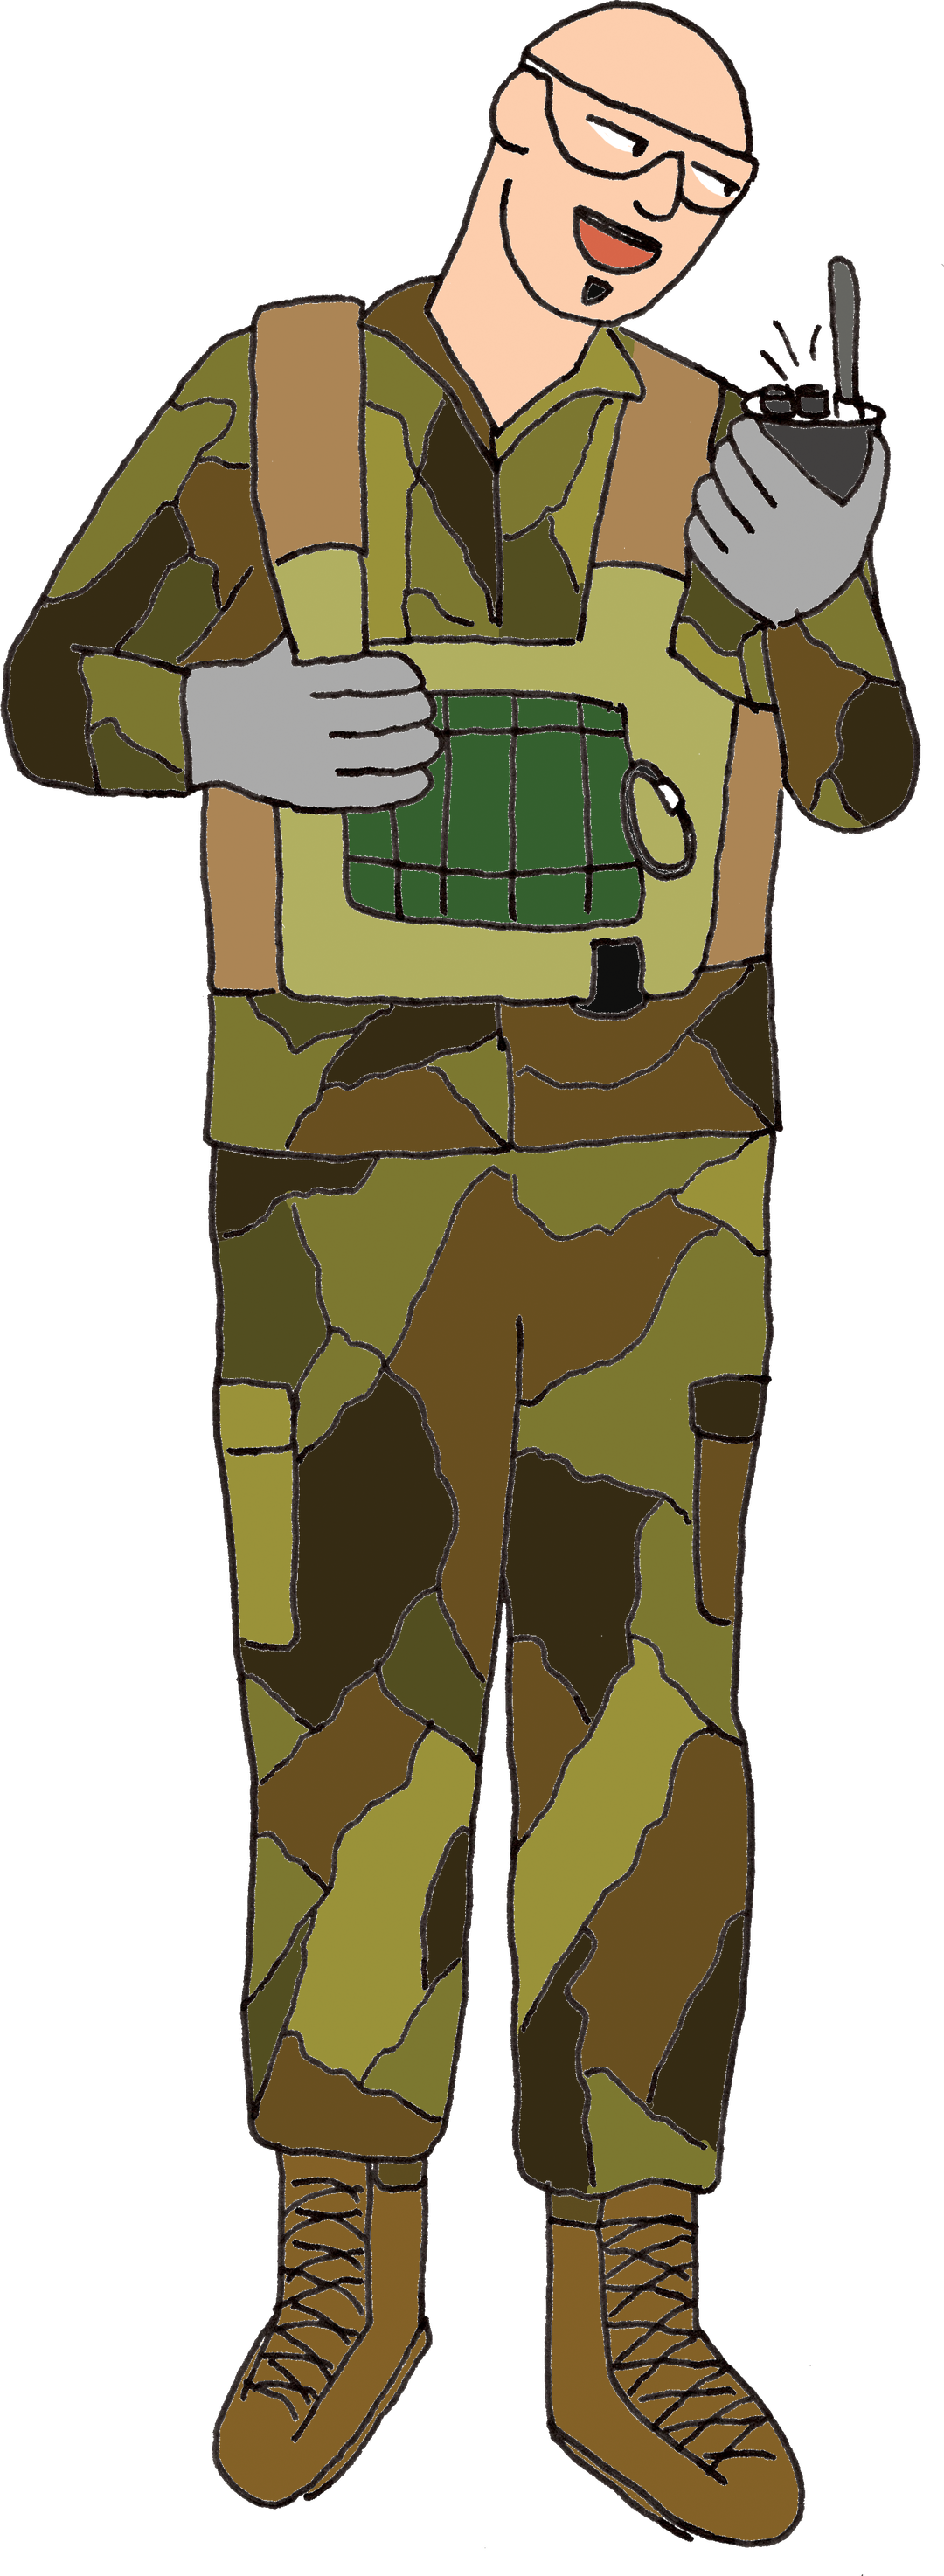
Oh, good question! It’s them – I wouldn’t change things like their skin colour, or their hair colour, or their body type. That felt really important, actually. For me, my only concern is with protecting their anonymity, they all wanted that. Nobody had notes on the illustrations, cause my illustrations are so fucking crude! No one’s going to look at it and be like, ‘Oh yeah, I know exactly who that is.’ But it would feel strange if I started making choices about whether to make Hunter bald. You know, like, he is a bald guy, and he does have a soul patch. Even that little bit of facial hair, I think says something about who that character is, and to have fabricated that would feel strange.
Caption
“Nobody had notes on the illustrations, cause my illustrations are so fucking crude!”
Mona Chalabi
INT:
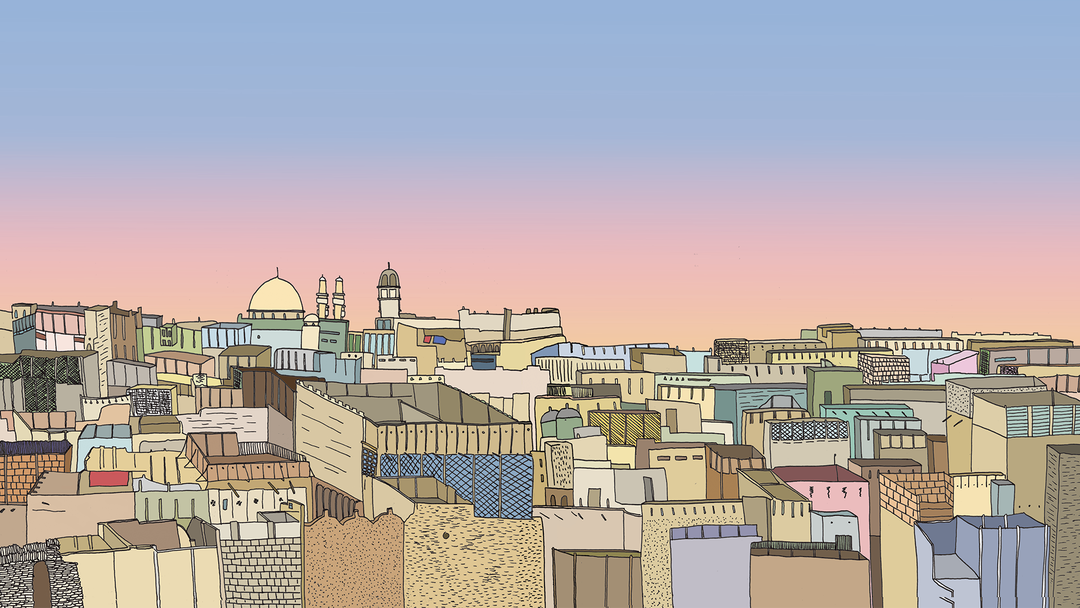
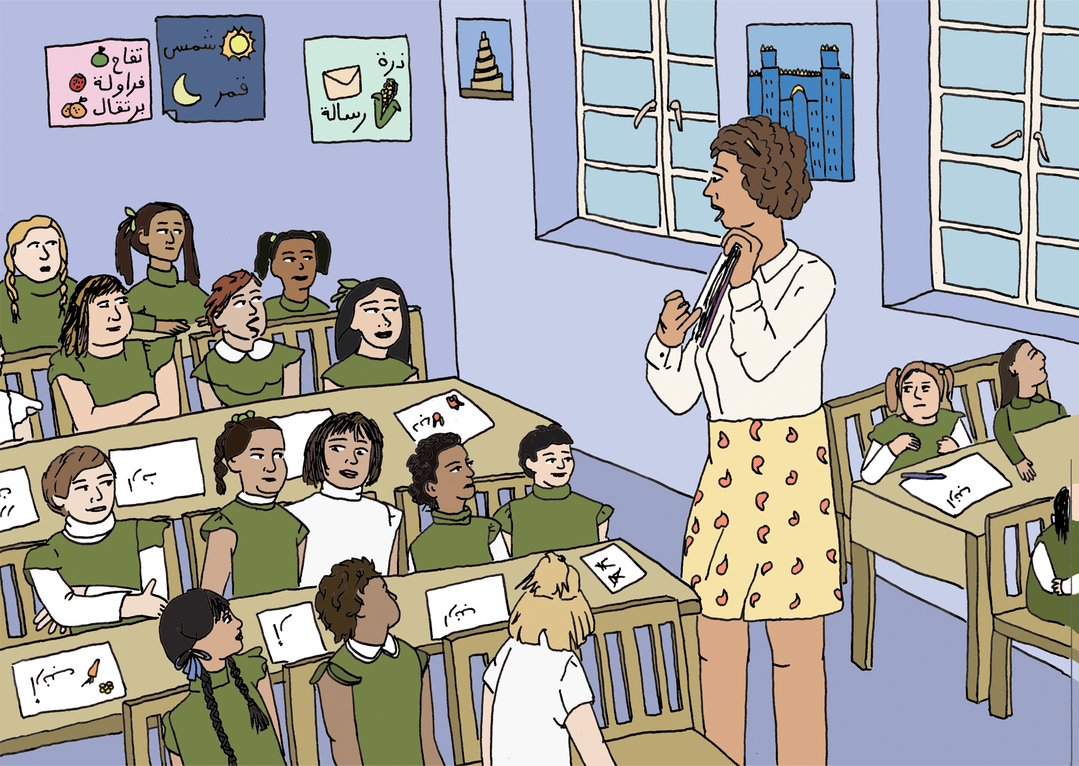
There’s one moment in the graphic novel chapter where you dedicate a whole spread to this very beautiful rooftop scene of Iraq, it feels like it could be a print within its own right. It’s a real moment to pause. I was wondering, even within topics this dense and complicated, why do you think it’s important to have moments of beauty, and of reflection?
MC:
I think there’s this impression that your speed of consuming information is consistent, right? But we all know that’s not true. Sometimes you’re tired, sometimes you’re like super alert, you might be on holiday when you’re reading. I think that with information that’s as dense as this, you want to give people a fucking break! I’m really attuned to this idea of people’s attention spans, and again, that’s part of the reason why I wasn’t interested in creating a book of just graphs. The idea that somebody is going to sit there and read a book about graphs from start to finish is a fantasy. I want to give people these moments where they don’t have to think about statistics for a second, and can kind of gear shift and just pause and slow down. As you say, it’s a moment to reflect: how are you feeling right now about what you just read? How are you feeling as you think about your own economic circumstances?
INT:
There’s also real moments of humour throughout. One of my favourite lines is: ‘If the American Dream were a storybook, the first page wouldn’t read, ‘When John was a little boy, he came into a huge inheritance.’ I also particularly liked the graph that replaces each bar with the middle finger. Why do you think it’s good to play with the ‘seriousness’ of graphs and data?
MC:
Humour has always been a really really important tool in my work. For me, there are two things that really matter with charts. One is comprehension, how easy they are to be understood, and then the other one is memorability, which I think really gets downgraded, but it’s crucial, especially for some of these subjects that I’m talking about. If I’m presenting you with data about Covid transmission rates or the efficacy of wearing masks, it matters that you understand it, not just in that moment, but six months from now when you’re having a fight with somebody about whether or not to get immunised for something.
Memorability really matters. Sometimes I’m using this bait-and-switch where it feels like a subject is really light and fluffy, but then actually, wait a second, once I’ve caught you, let me explain to you how this is actually really serious!
Caption
Caption
Caption
INT:
What were there challenges when designing and illustrating a publication that’s intended to be accessible, but also deals with very serious topics?
MC:
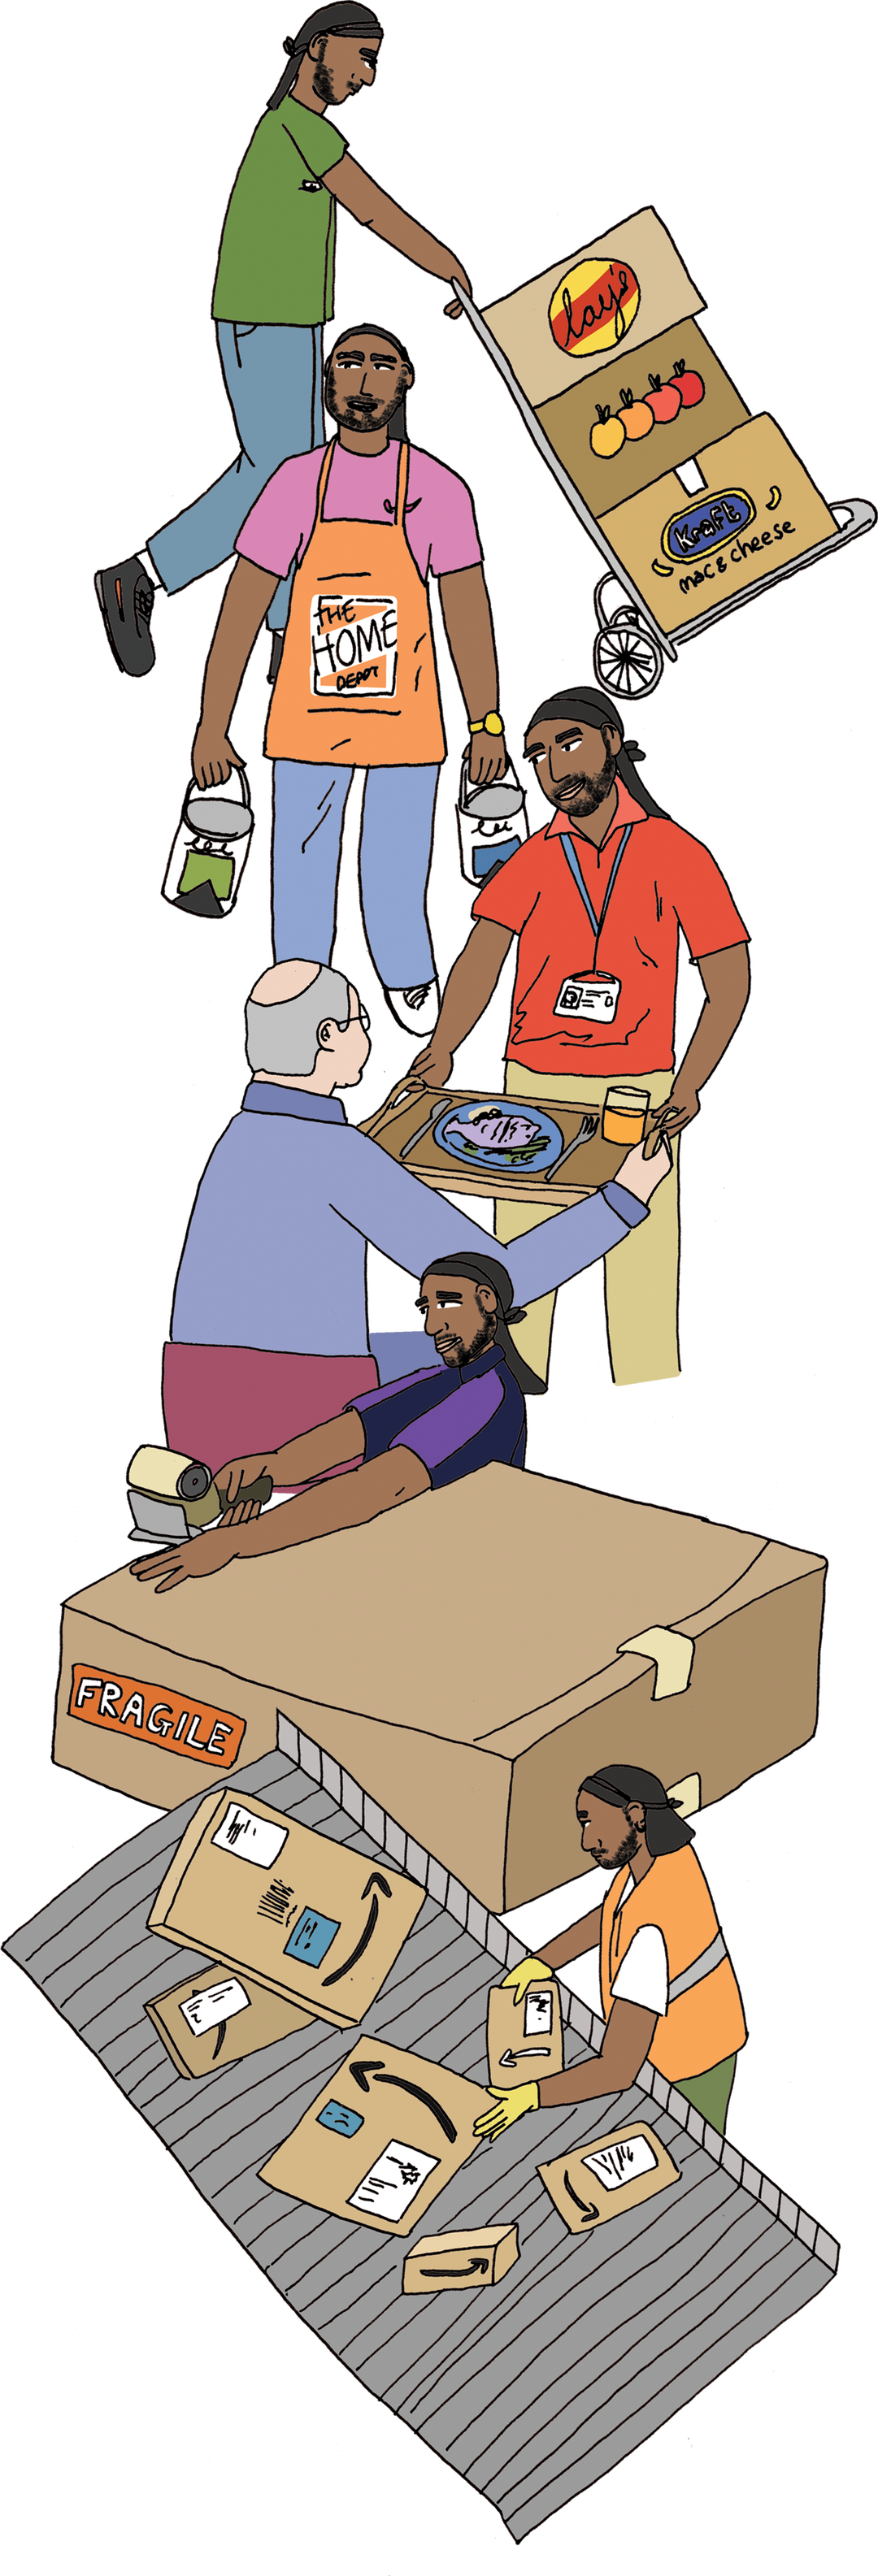
I feel really conflicted about the way that I do design, because I like the way that the book feels accessible. We had initial ideas of each chapter having a colour wash on each chapter according to which decile it is, but the concern was that it would look like a textbook, and I really don’t want it to feel academic. And yet, sometimes, I worry that because my style is so childlike and like, ‘Oh, don’t worry about me over here, I’m just doing this little doodle of a really weird-looking baby,’ that people might lose sight of how rigorous the research actually is. There’s nothing childlike about the work that goes into it. From a design perspective, it’s really hard. How do you communicate how robust something is without making it feel alienating, or cold, or dry?
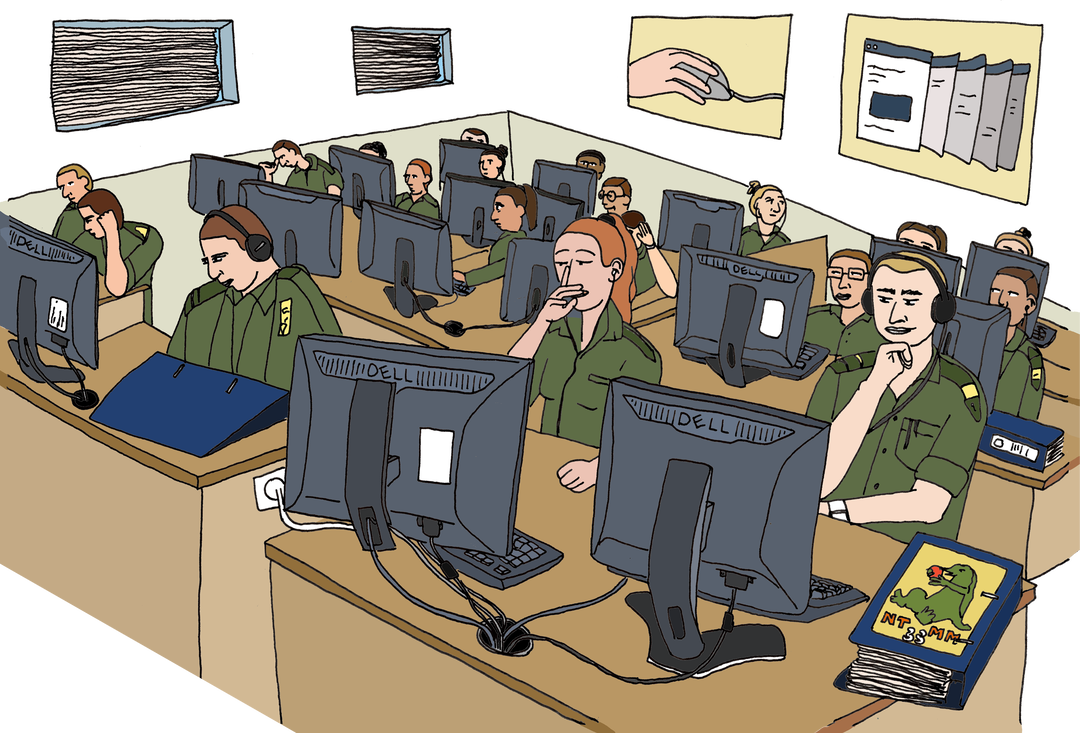
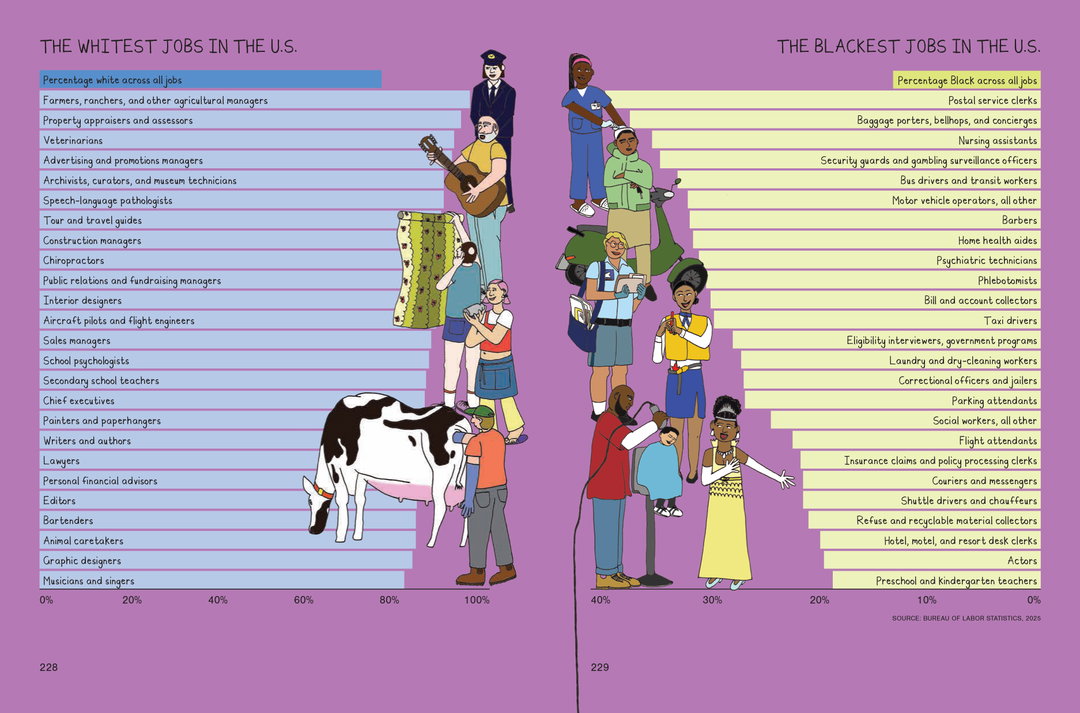
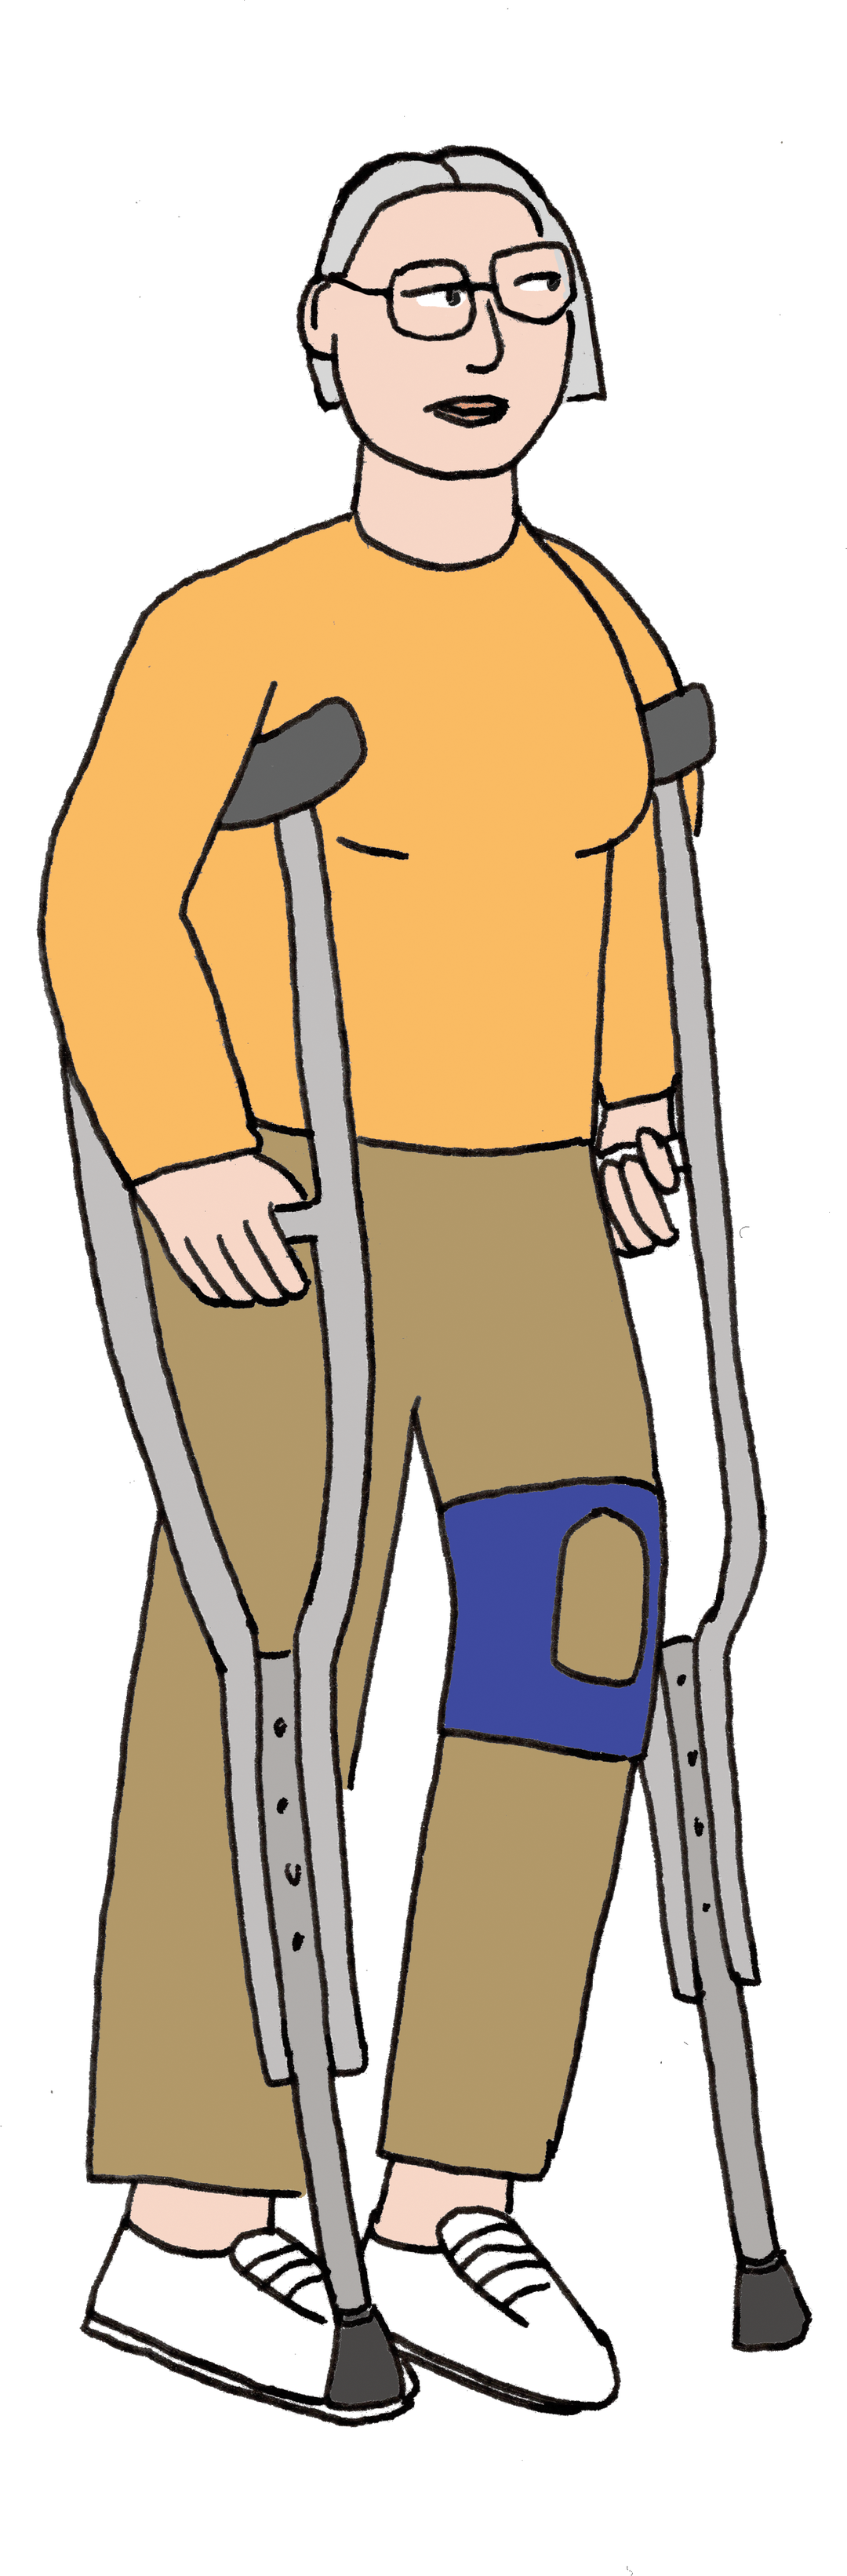
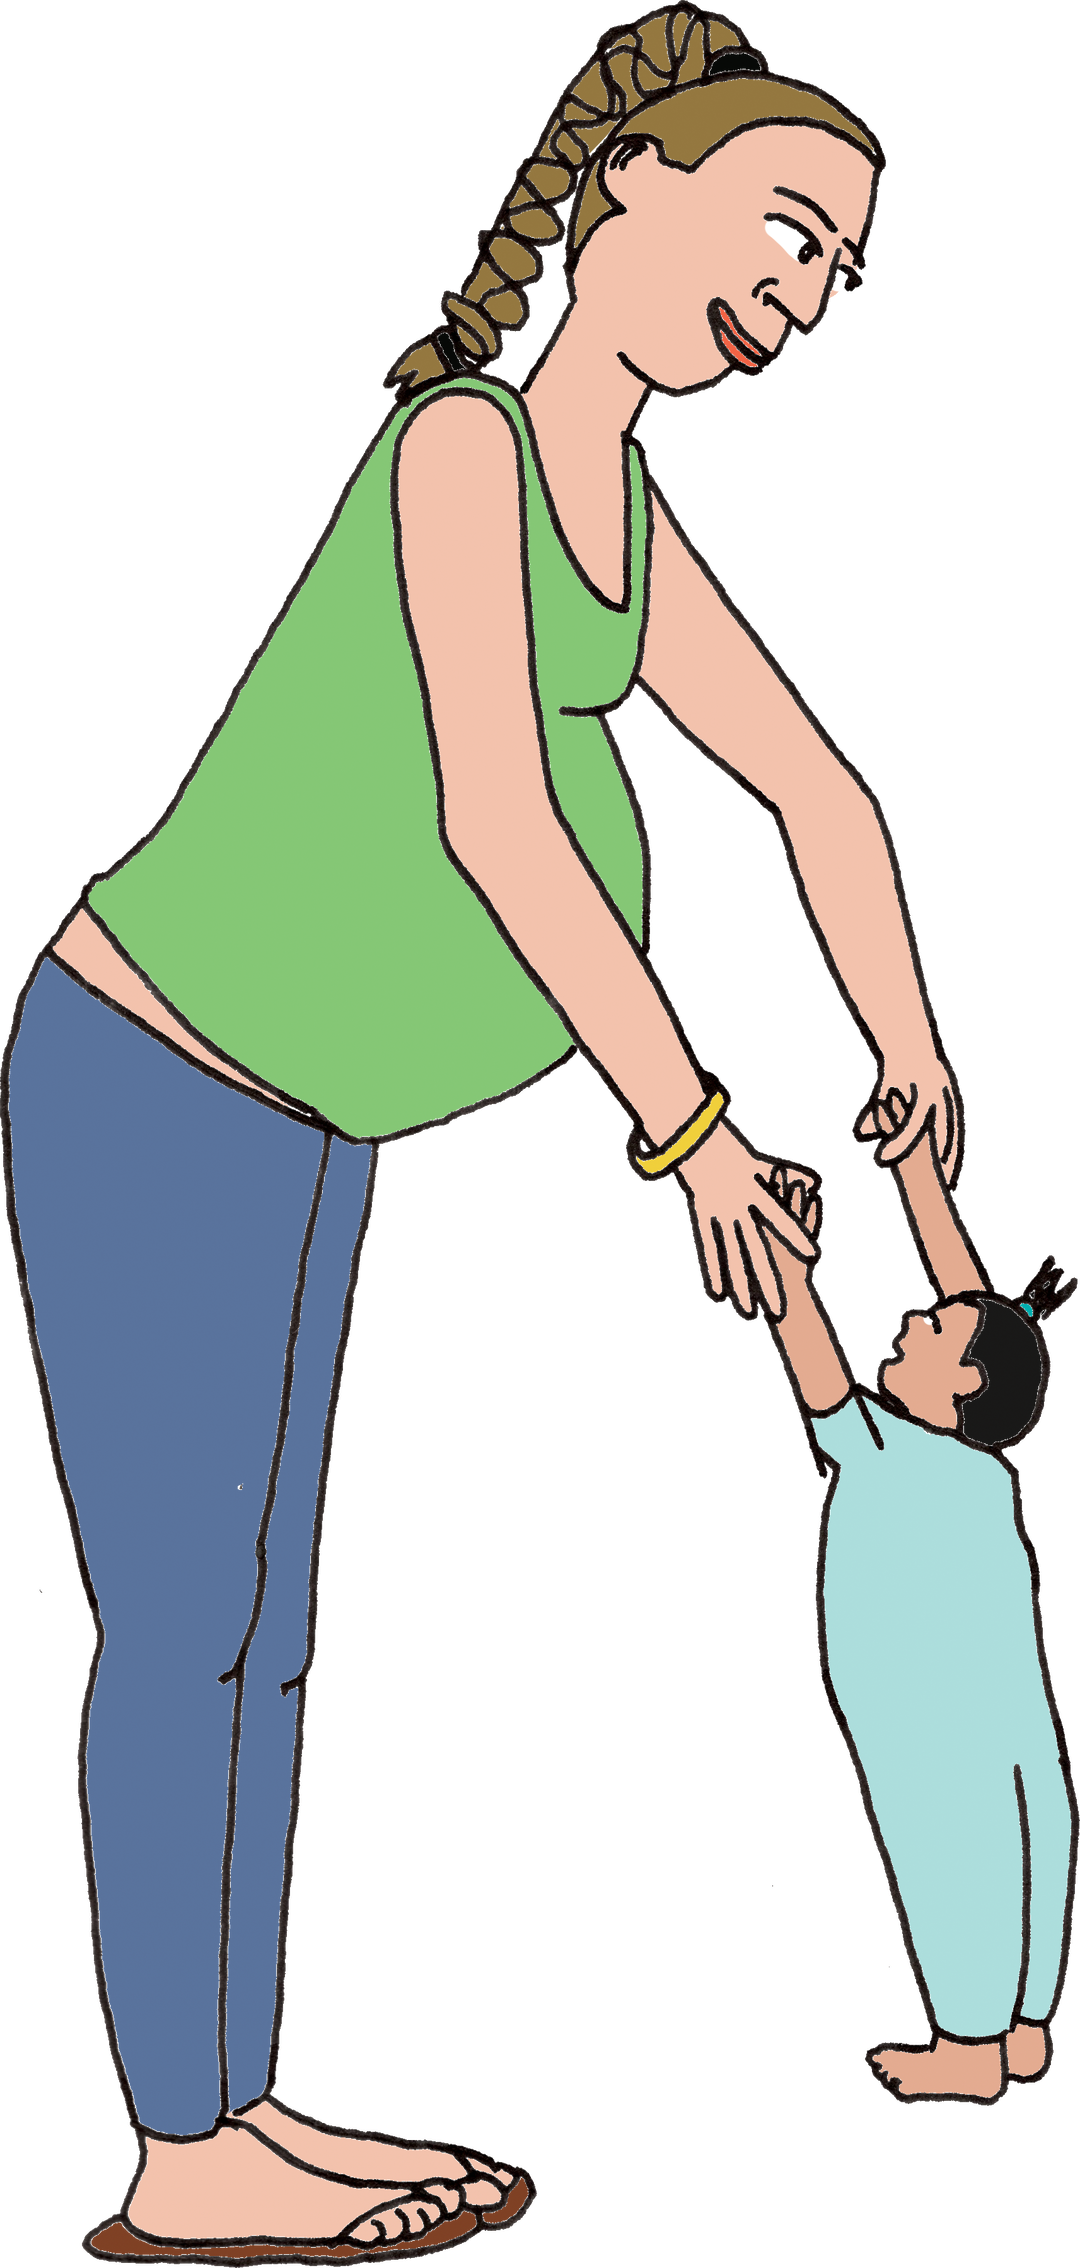
There’s one chart I feel quite good about [below]. Elana and Jordi were keen for it to have characters, and I think it really elevates it. It’s quite clear that this is just very straightforward data about who does what. But it’s never just about the images, is it? It’s always about the words. I wanted to use the words as they are in these categories, as they appear in the official dataset from the Bureau of Labor Statistics, like ‘home health aides’. So many of these official datasets, the language that is used in them, it’s not just that the numbers are alienating, it’s also the language. What is a ‘home health aide’? It’s somebody who comes and helps you with fucking everything, like brushing your teeth, holding your hand, these words just don’t capture the enormity of what people are doing.
“From a design perspective, it’s really hard. How do you communicate how robust something is without making it feel alienating, or cold, or dry?”
Mona Chalabi
INT:
I think this simplicity is so important: it’s elucidating things that are purposefully cloaked in a veil of obscurity. This visualisation helps because you can be like, ‘Oh, I know someone who wears that uniform! This isn’t a vague term, my aunt does that.’ You can relate to it better, and so understand it more.
MC:
Yes, I love that. I hope that the person ‘in’ each chart will find themselves in it. And that’s been such a key guiding force of my journalism, and it’s part of the reason why I’m quite unashamed actually about seeking bigger audiences, because the bigger audience you have, the more likely it is that the thing that you are representing, that person will be able to find themselves in it.
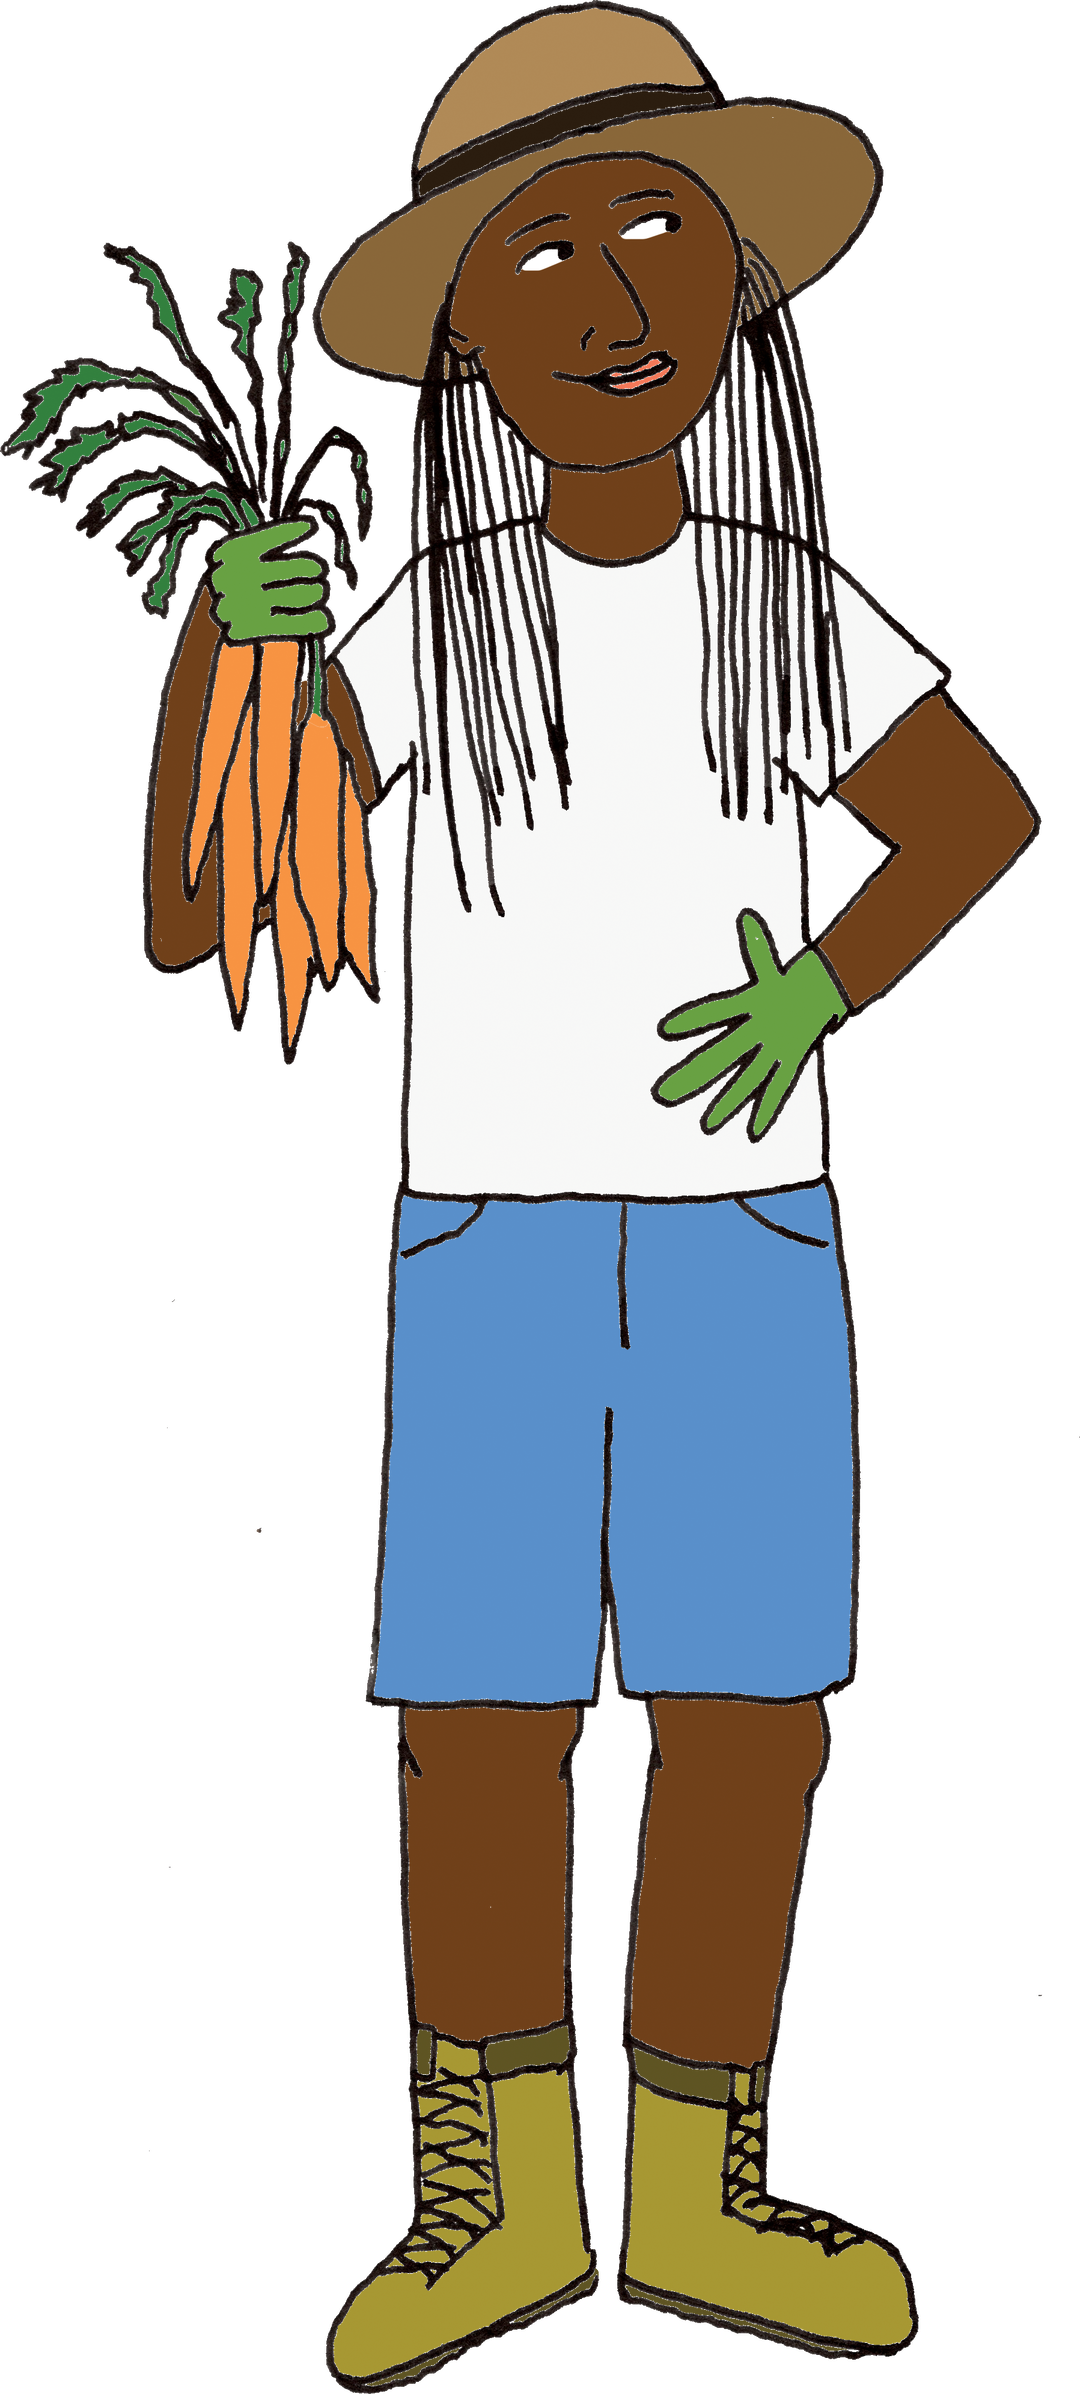
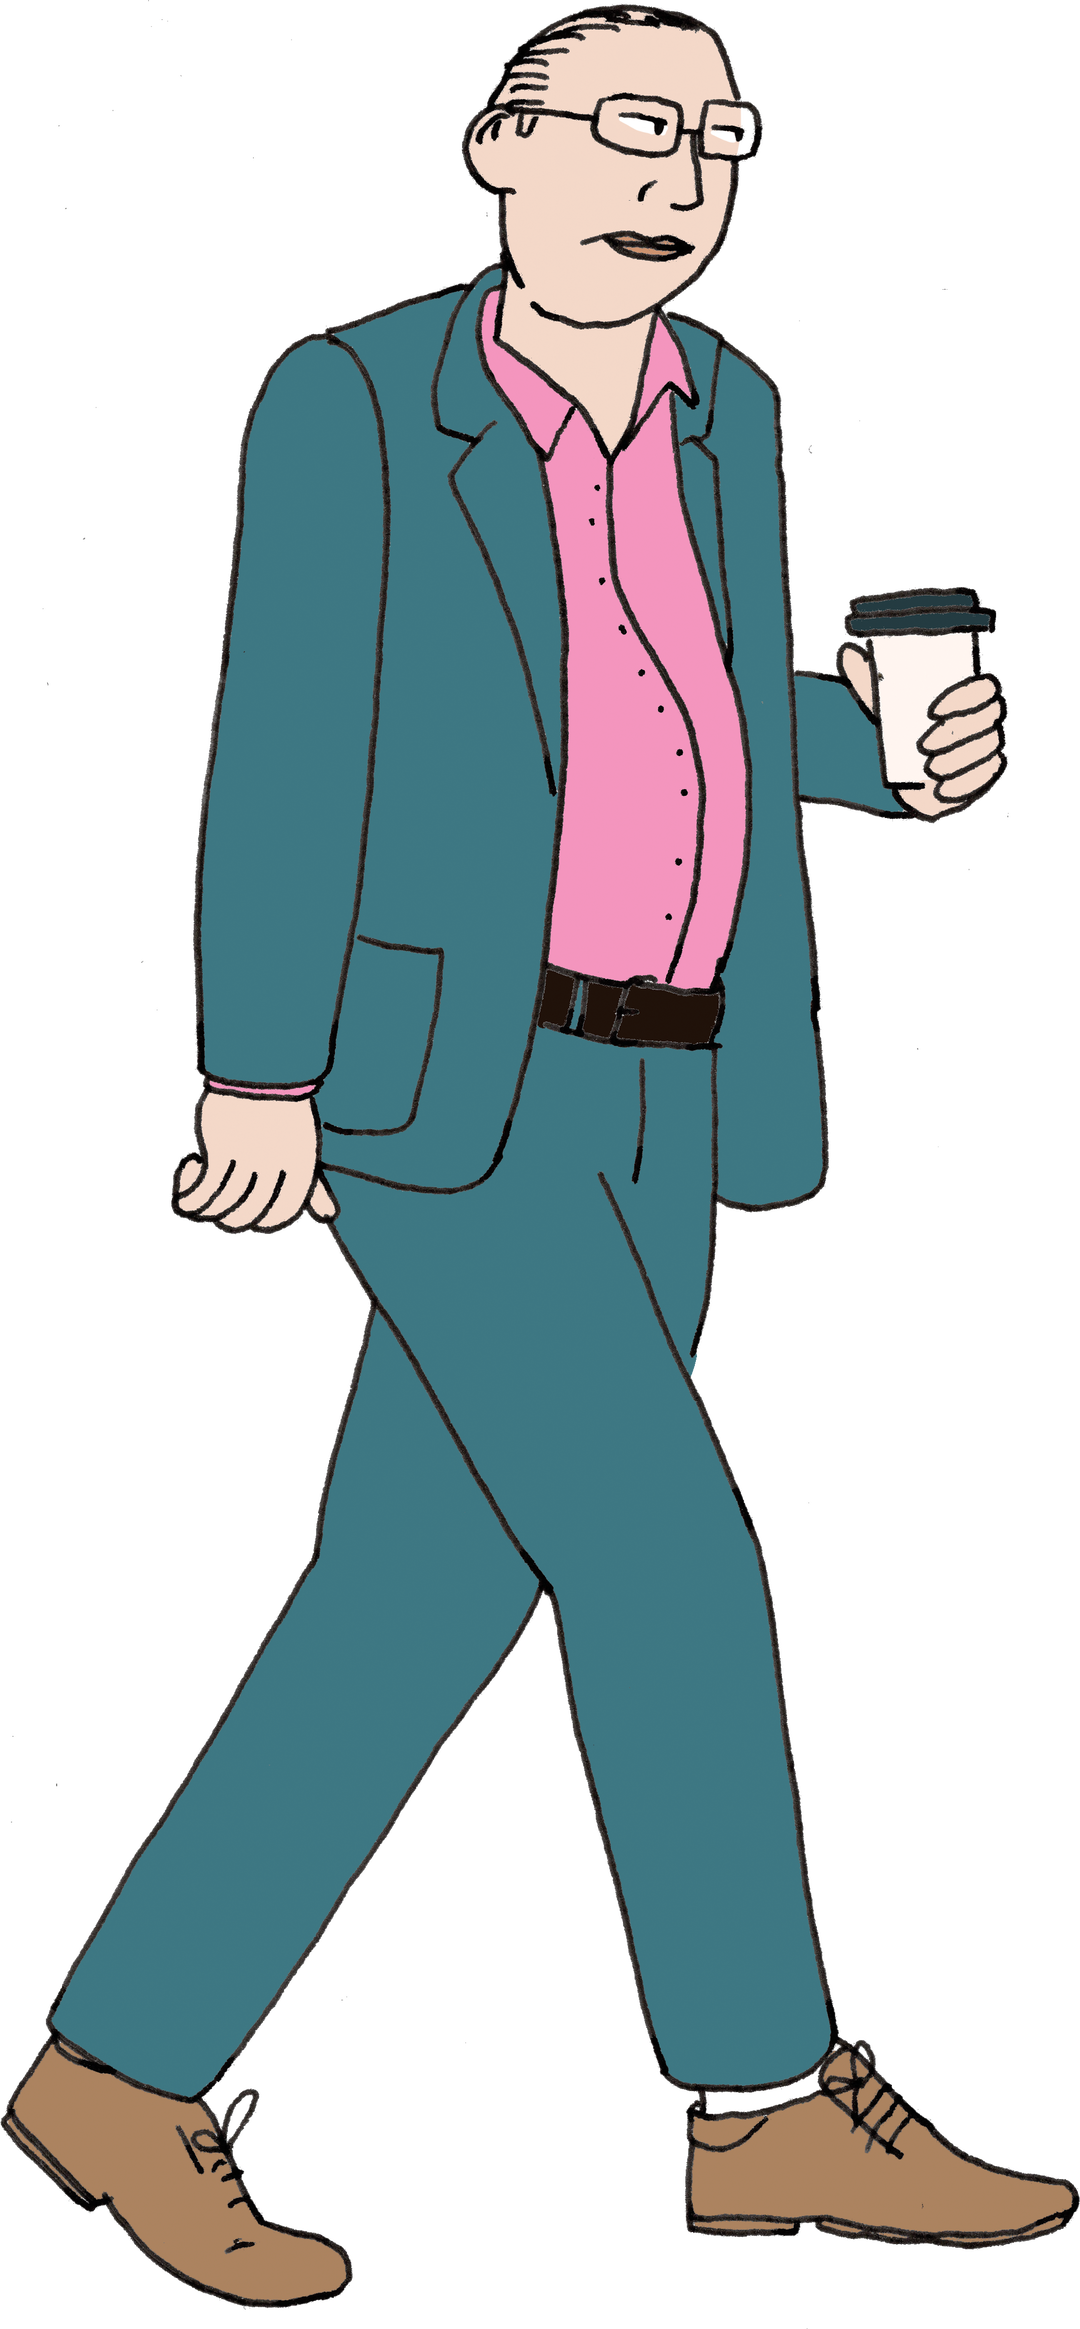
I think it’s interesting, because the datasets are flawed, right? Because they’re flawed, it affects the way that you visualise it. Basically every single dataset that I will look at will contain at least two categories: men and women. I know that’s not the way that the world works – there are more than two genders, and the sets very often conflate sex and gender; it’ll alternate between male and female and men and women. Say I’m choosing to represent something by men and women, what’s the visual language that I’m going to use to depict men and women? Am I going to use a little dress for a woman? These forms of visual representation really fucking matter, because they either challenge power or they lean into it.
So how can I represent the dataset, in a way that also challenges it? The tricky thing is, if you try to get too smart and too subversive, people are going to look at it and get confused – this is the truth too. You need that speed of comprehension. Something that I’ve done in the past is when the dataset says men and women, I’ll just use like a big ‘M’ that’s like ornately illustrated to represent men, and a big ‘W’, so you’re leaning into the fact that it’s about language rather than about something that’s ‘inherent’.
1 of 4
1 of 4
INT:
So it’s essentially a balance of adhering to the biases and the stereotypes that everyone has, while also trying to incrementally change them in the process?
MC:
Yes! That’s exactly it. I think as designers we have a responsibility to not cop out, because we’re also determining what those visual norms are, and we have the ability to change them.
INT:
The first layer has to be instant comprehension, the instinctual ‘I understand this’, and that’s only when you can get people with the facts.
MC:
Exactly. I talk about sequencing a lot, I use it on Instagram carousel features: let me give you something that’s really fucking easy to understand, and then I want to incentivise you to swipe, then I add an extra layer of complexity. Whereas if you show all of that information at once, that visual bombardment of information only works for people who are deeply fucking interested in the subject. Which is my critique of infographics. I hate the language of infographics – they’re always trying to do everything at once!
INT:
The book is about to be out into the world. If there was one thing that someone took away from this, or one action that this book made someone take, what would you hope it might be?
MC:
Part of the message of the book is that class doesn’t show up enough in our intersectional identities, and that that’s fundamentally dishonest. I would hope that people read the book and then get much more fluent and comfortable with describing their current wealth and income, as well as the one that they grew up in. I think that’s kind of ambitious, but you never know.
Caption
Share Article
Further Info
About the Author
—
Olivia (she/her) is associate editor of the website, overseeing the day-to-day editorial projects as well as Nicer Tuesdays events. She joined the It’s Nice That team in 2021. ofh@itsnicethat.com
To submit your work to be featured on the site, see our Submissions Guide.