


Launch Recite Me assistive technology
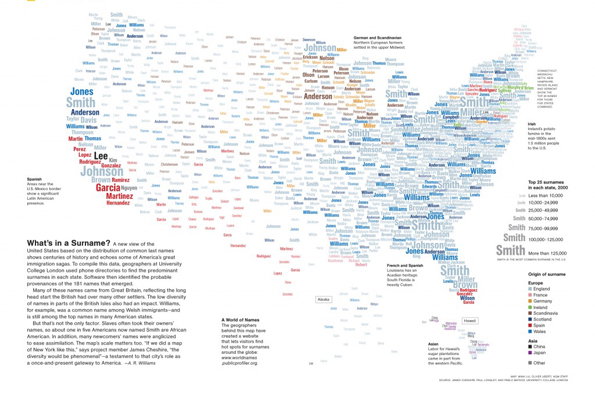
An infographic map of the US created from a dense cloud of surnames. The names vary in size and colour, with “Smith” appearing as the most prominent name across the country.

The inaugural Information is Beautiful infographic shortlist is great

—
Date
14 August 2012

There’s so much top-quality infographic work appearing all the time that it was anomy ever a matter of time before someone decided that this area of visual communication needed its own awards. Luckily for all of us it’s the excellent David McCandless and his Information is Beautiful agency that have stepped up to the plate so we could rest assured the process was going to have integrity, and the just-released shortlist for the inaugural gongs is a humdinger. There’s six categories – data visualisation, infographic infodesign, interactive visualisation, data journalism, motion infographic and tool or website – and from climate change and immigration to someone’s CV and this history of science fiction there’s a an eclectic wealth of great work on offer.

There are some familiar projects on show (like the Fat or Fiction foodie infographic we covered earlier this year but there’s plenty of stuff we’d never come across too, so whether you’re an infographic anorak or just a sporadic enthusiast this site is well worth some of your time.

The winners will be announced at the end of September.
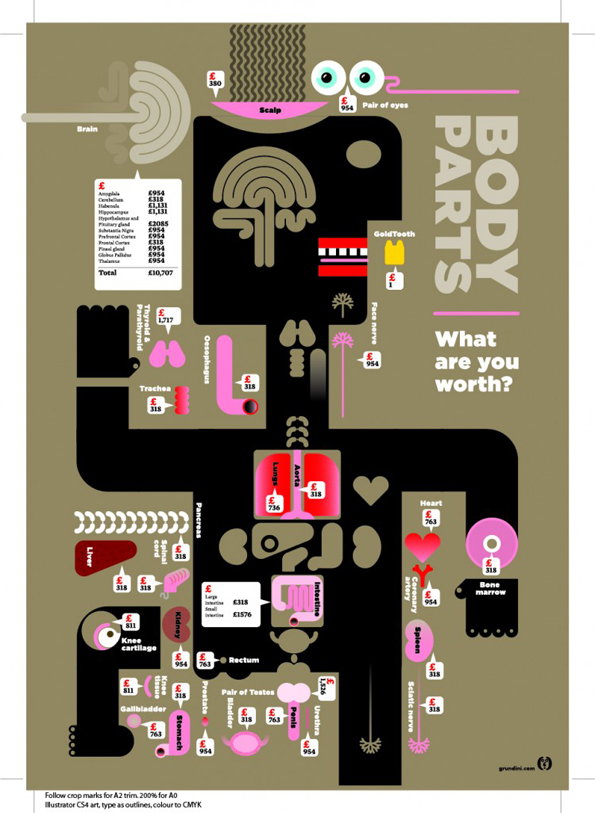
An infographic titled “BODY PARTS” asks “What are you worth?” against a dark background. A stylised human silhouette is filled with various organs and body parts, each labelled with a price tag in pounds.
Above

Esquire Magazine: Body Parts

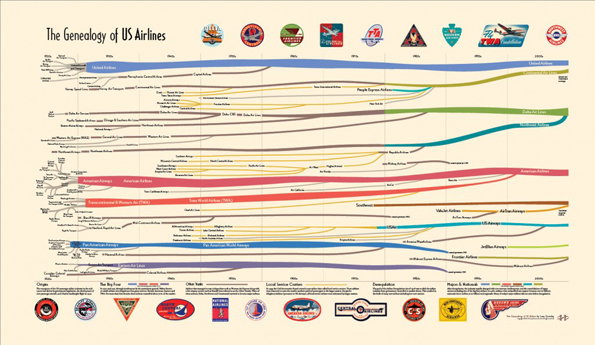
An infographic titled “The Genealogy of US Airlines” shows a complex web of colourful lines tracing the history of aviation. The lines merge and split across a timeline to illustrate mergers and acquisitions, with various airline logos lining the top and bottom edges.
Above

Larry Gormley: Genealogy of US Airlines
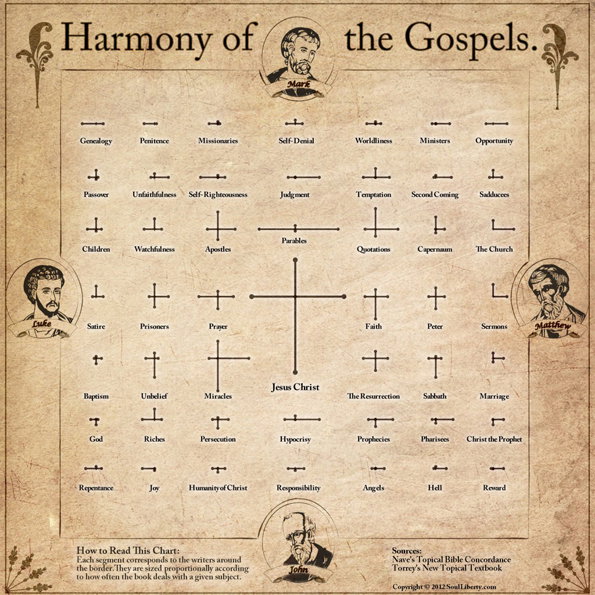
An infographic titled “Harmony of the Gospels” on a parchment-style background. A central cross is surrounded by a grid of lines and labels, such as “Miracles” and “Parables”, connecting the portraits of Mark, Luke, Matthew and John.
Above

Robert Rouse: A Visual Harmony of the Gospels
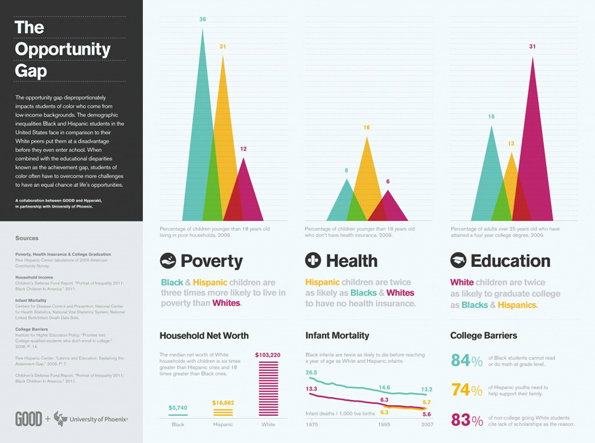
An infographic titled “The Opportunity Gap” uses colourful peak charts to compare poverty, health and education statistics. Data is broken down by demographic, highlighting disparities for Black and Hispanic communities in the US.
Above

Hyperakt: Deroy Peraza, Eric Fensterheim, Josh Smith: The Opportunity Gap
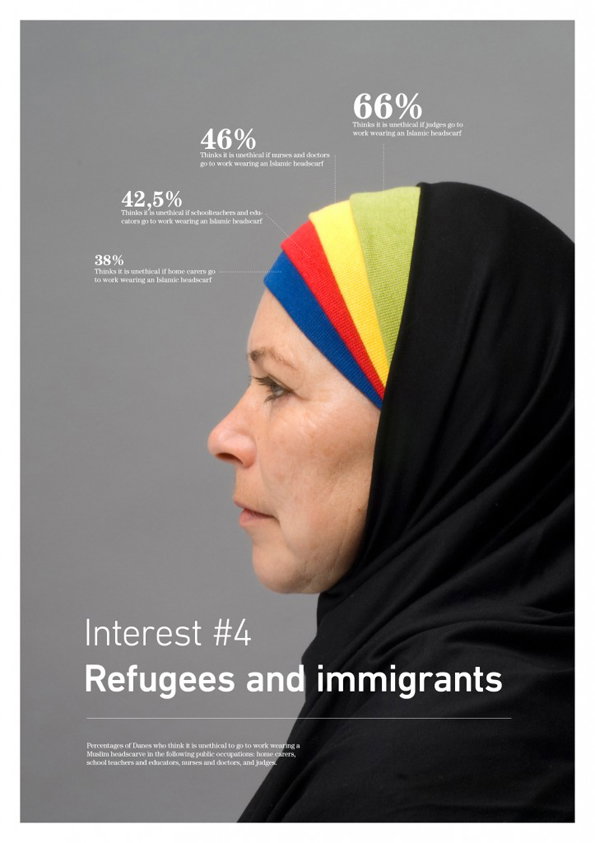
A profile portrait of a person wearing a black hijab with a colourful striped band across the forehead. Above them, a series of percentages and text describe the views of Danes on wearing an “Islamic headscarf” in various public occupations. The bottom of the image features the title “Interest #4” and a bold headline that reads “Refugees and immigrants”.
Above

Peter Ørntoft: Refugees and Immigrants
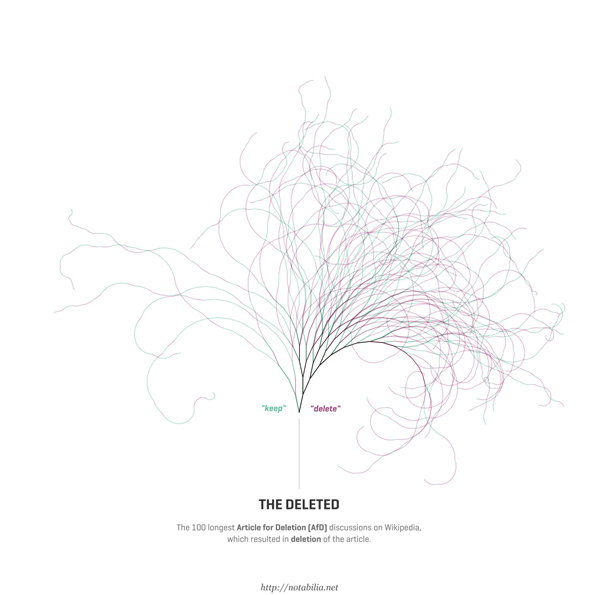
A data visualisation titled “The Deleted” shows a tangle of thin, colourful lines branching upwards like a tree. The lines are split into two groups labelled “keep” and “delete”. Text below explains the work represents the 100 longest Article for Deletion discussions on Wikipedia.
Above

Moritz Stefaner, Dario Taraborelli and Giovanni Luca Ciampaglia: Notabilia
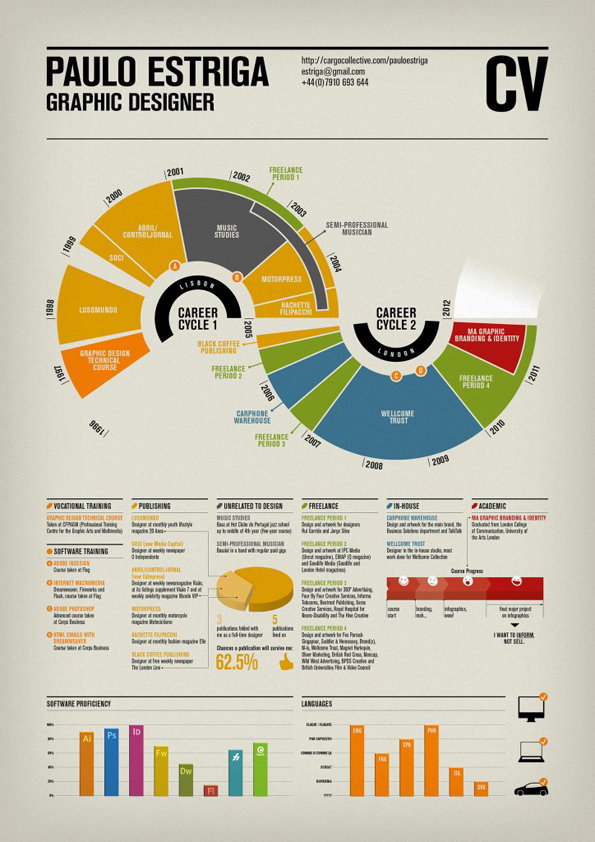
An infographic CV for graphic designer Paulo Estriga. A central circular timeline is split into two halves, “Career Cycle 1” in Lisbon and “Career Cycle 2” in London, mapping his professional experience from 1996 to 2012. Below the timeline, detailed sections categorise his training, publishing work, freelance projects and software proficiency.
Above

Paulo Estriga: Infographic CV

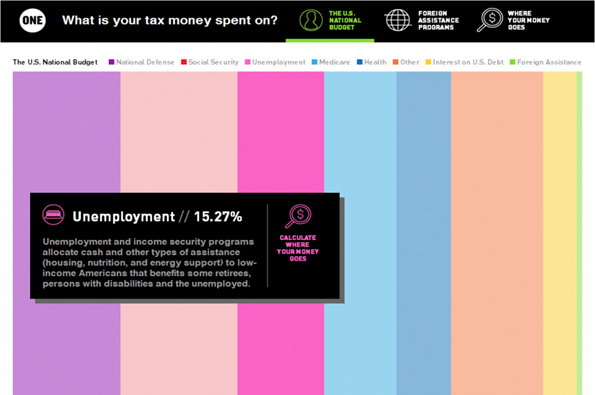
An infographic titled “What is your tax money spent on?” shows the US national budget as a series of colourful vertical stripes. A black pop-up box highlights the “Unemployment” section, stating it accounts for “15.27%” of the budget.
Above

Lybba: Where Your Money Goes

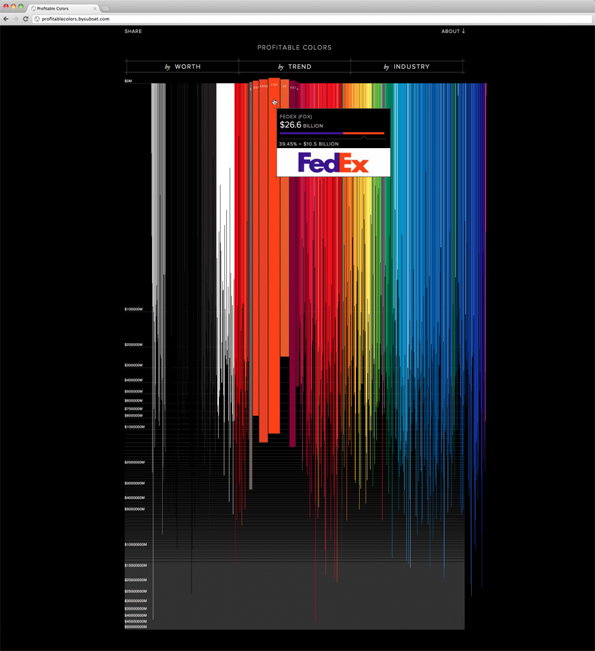
A data visualisation titled “Profitable Colors” shows vertical bars of different colours and lengths against a black background. A pop-up window highlights a red bar for “FedEx”, listing a value of “$26.6 Billion”.
Above

Andreas Braendhaugen, Gregor Hochmuth, Sarah Nahm: Profitable Colours
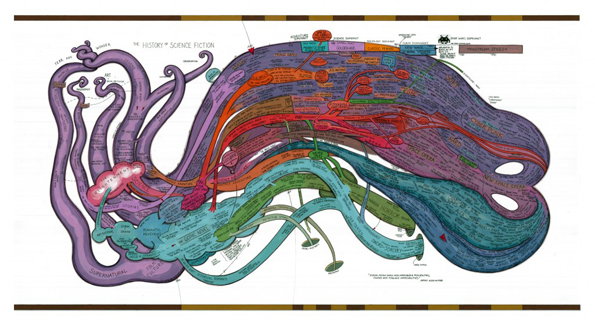
An intricate illustration mapping “The History of Science Fiction” as a series of colourful, interlocking organic shapes. The flowing ribbons of purple, red, green and blue are densely packed with text and labels.
Above

Ward Shelley: The History of Science Fiction

Share Article

About the Author

Rob Alderson

—

Rob Alderson is a freelance writer, editor and strategist. He was previously editor-in-chief of It’s Nice That and WePresent, and editor of Design Week. He publishes the newsletter Undo, which tries to make sense of how AI is changing design work, the design process and the design industry.

It's Nice That Newsletters

Fancy a bit of It's Nice That in your inbox? Sign up to our newsletters and we'll keep you in the loop with everything good going on in the creative world.